
In the crypto market, various tools are available to analyze the market, predict its movements and decide on the best move to make and profit. These tools help professional traders to be able to analyze the market properly in any situation and to be able to profit from it. One of these analyzes is time analysis, which is one of the important tools for market activity. In this post, I will review this analysis and its sub-branch tools. stay with me.
What does time analysis mean?
In technical analysis, there are two important components: price and time. By analyzing these charts, analysts can make a fairly accurate prediction of the price of a cryptocurrency. Considering that these charts fluctuate and are not fixed, analysts examine them in different time frames and sets. This review allows them to more accurately review useful and practical information and make a correct prediction of the price of the property in question.
The best tools for time analysis in cryptocurrency analysis
Due to the fact that time analysis itself is considered as technical analysis, this analysis has tools that allow analysts to examine and analyze the market better. These tools refer to different cases of the market, and for a proper and correct analysis, several analyzes must be used simultaneously or in combination.
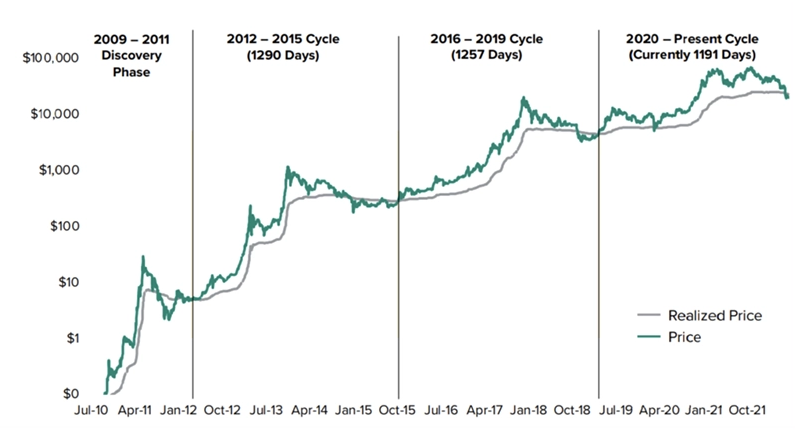
Time Cycle
Time cycles in technical analysis refer to a cycle in which a specific event occurs; For example, in a 3-day cycle, the price of a cryptocurrency reaches a minimum and then a certain maximum. More colloquially, for example, the cycle of passing a year is 365 days, or the cycle of a heartbeat is about one second.
Time cycles help analysts to identify the events of a certain period of time that happen and repeat in a cycle and use this information to make their predictions. Time cycles are also best used when used in conjunction with other analyses.
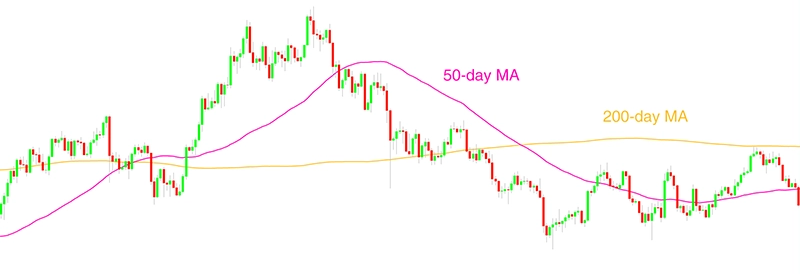
Moving Average Index
One of the most famous indicators in technical analysis is the moving average, which shows the average price of an asset in certain time periods. The most important benefit of this tool is to provide the average price in real time. This index is updated real-time and helps analysts to have an overview of the market and asset price movements. The moving average (or MA for short) has two types:
- Simple Moving Average (SMA): In this type of moving average, the price of an asset is simply averaged over a certain period of time. In this method, different prices are added together in a period of time and finally divided by the number of these prices. This tool is used for various purposes such as determining entry and exit points and identifying resistance and support levels.
- Exponential Moving Average (EMA): This tool works a little differently compared to the simple moving average, and instead of checking price ranges, it reacts more to recent market prices. Also, this tool is a bit more complicated than SMA and requires more calculations.
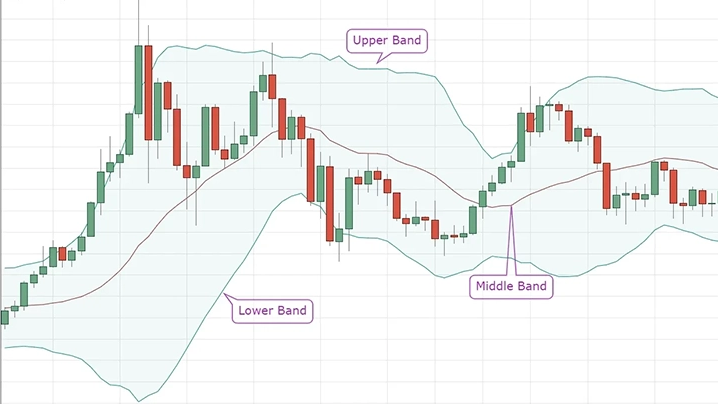
Bollinger Bands Index
Another popular indicator of technical analysis is Bollinger Bands, which identifies saturated areas in buying and selling for analysts. Bollinger Bands can be used in two time frames, short and long-term, and consists of three lines; The middle line is a simple moving average and the other two lines are above and below this average.
The market signals in this analysis are based on the fluctuation of the middle line or the simple moving average; The price in this line fluctuates towards both its upper and lower lines, and after examining these fluctuations, the signal obtained from the analysis of Bollinger Bands is issued. For better conclusions, analysts combine this analysis with other analyses.
In the analysis of Bollinger Bands, a specific formula is used to determine the signal. To use it, we must have a better understanding of the Bollinger Bands chart of an asset. As mentioned, the middle line in this indicator is a simple moving average set in the 20-day period, and the other two lines above and below it are several standard deviations (SD) from the middle line. They differ. The values in this chart can be changed according to the needs of the analyst.
RSI Index
In this indicator, the average increase in prices in a certain period of time is calculated, divided by the average decrease in prices in the same period, and finally the answer of this equation becomes an understandable and percentage number using mathematical tools. The higher the number of the RSI indicator, the longer the number and length of the green candles in the chart compared to the red candles, and the smaller the number of the RSI, the opposite of this happens in the chart.
Buy and sell signals in RSI can be analyzed in two ways; The area above 70% (RSI index number) is called the overbought area and the area below 30% in this index is called the oversold area. The exit of this indicator from the maximum selling area is considered as an analysis for buying and vice versa (exiting from the buying area is also considered as a signal for selling).
In this post, I discussed time analysis and its tools. Traders and analysts use various types of analysis to make profit from the market and predict its prices, including technical analysis, and time analysis is also in the same category of analysis; So, if you are active in the digital currency market and are looking for more profit, be sure to learn how to work and use these analyzes completely.