
So much hasn't changed in the last 24 hours in the "bitcoin market"... remember that the market is always a psychological game. Can this be an indication of a more bearish run?
24-hour chart analysis 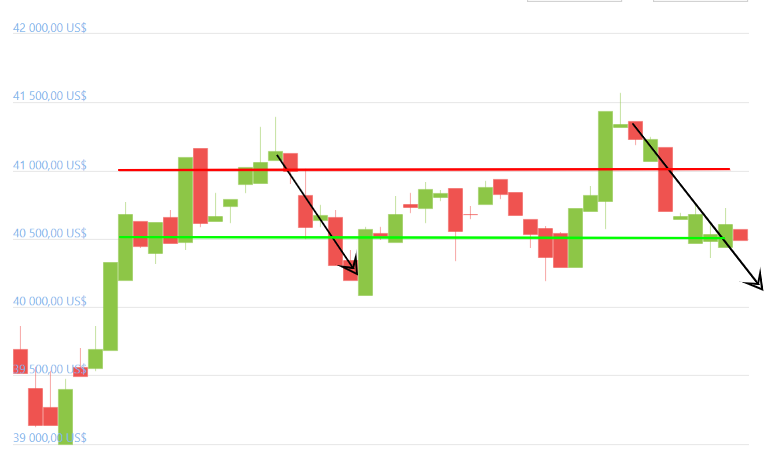
If we look at the chart we see a support and resistance difference between $40,500 and $41,000 witch very low considering that bitcoin has historical data of being very short-term volatile. This can mean a lot of things like a more bearish market or at least a downtrend for bitcoin on the other hand of the spectrum maybe the short distance between support and resistance also can be an indication of a more solid and enduring market.


