This is part #1 in the Crypto insights series analyzing Bitcoin. Below are my future writing plans:
- Part #1: Community growth VS transaction count
- Part #2: Difficulty VS hashrate
- Part #3: Tether supply correlation
- Part #4: Putting it all together
The law governing real network value
Metcalfe's law states that the value of a communication network is proportional to the square of the number of connected users.

Let's see if we can apply this law to cryptocurrencies, namely - Bitcoin:
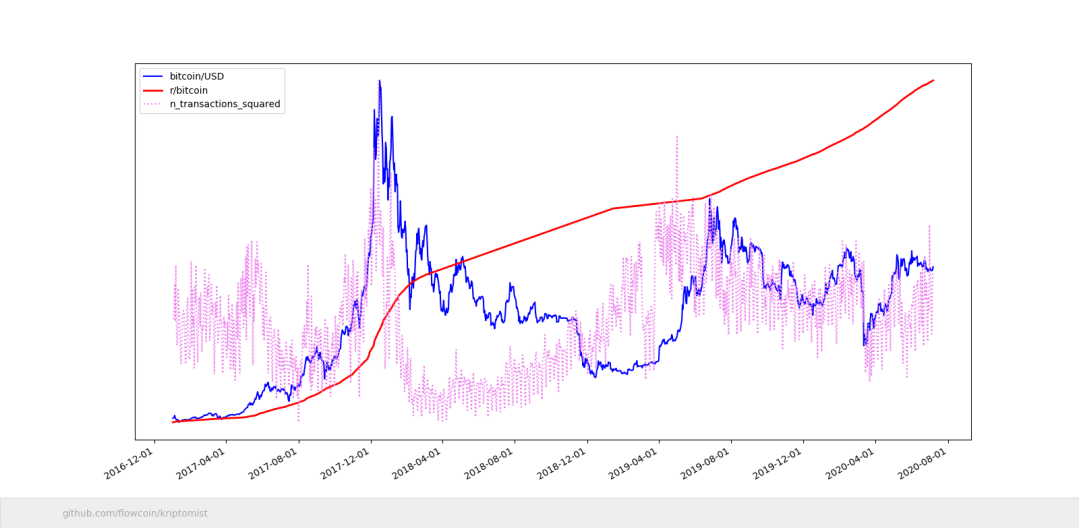
One might argue, looking at the chart above, that there exists a correlation between r/bitcoin subbredit growth speed (slope of red line) and the price (blue). Even more obvious, the price of bitcoin seems to be correlated to the number of transactions squared (violet), especially during the last 12 months.
Why? One way to look at it is the Metcalfe way mentioned above. But there is also a different explanation.
By common sense, when $BTC goes up, so does the total hashing power of the network - more miners find it profitable. Conversely, when $BTC decreases in value, so does the hashing power. And because the mining difficulty is adjusted every 2 weeks, more hashing power means more produced blocks - more transactions per day.
How would you interpret the above chart? Curious to know.


![Code Is Law]: Why Autonomous DeFi Lending Protocols Are Displacing Centralized Crypto Exchanges](https://www.publish0x.com/img/1182941.png?action=resize&ar=1&h=191&inv=0&ori=1&st=1&up=1&w=340&signature=72d35c0c95dd34da8e3ea17a0b8eb472489ffeb72ab4ca4908cf8ebc3e23e744)

