
The rally was driven by the announcement that Trump Media & Technology Group and Crypto.com have entered into a strategic partnership on Cronos. The deal includes the integration of the token into the Truth Social and Truth+ platforms, a purchase of about $105 million in CRO, and the creation of a $1 billion public treasury. For details: Trump Media and Crypto.com hit the stock market with $CRO: 25% BOOM for the crypto. 🚀
📊 On the monthly chart, we have an overview of $CRO’s price action. Here we can see its ATH at 0.955 USDT, recorded in November 2021, from which a long bearish phase began, pushing the price down to a low around 0.0497 USDT in August 2023.
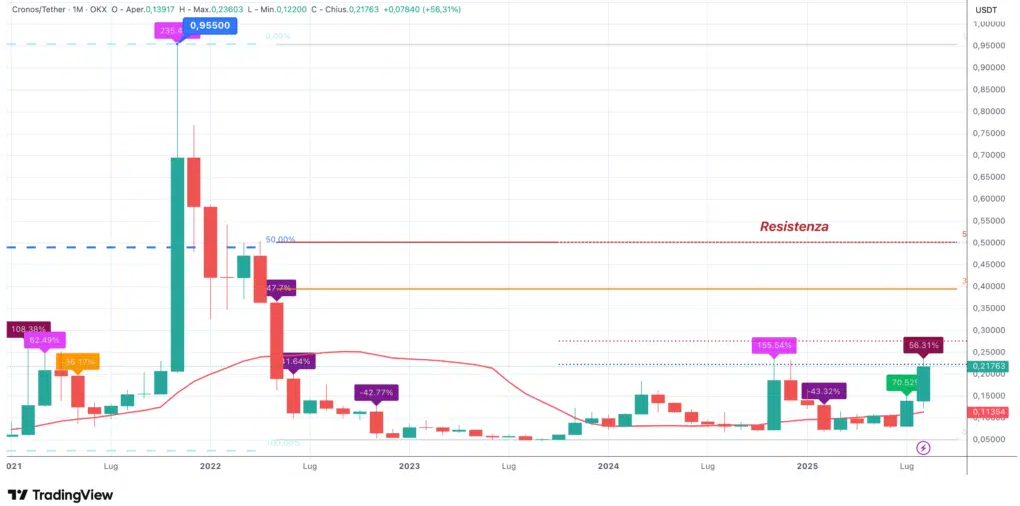
In this zone, the price built a base between December 2022 and the end of 2023, attempting a first bullish swing that was later retraced. The real bullish move only started at the end of 2024: in November, $CRO surged +155%, reaching resistance in the 0.2230 USDT area.
The vector resistance at 0.2230 USDT had already been highlighted in the analysis of December 23, 2025. That level rejected the price, triggering a new contraction phase during 2025. In February, a low of 0.0683 USDT was reached, from which CRO built a consolidation base lasting about five months, before the July restart and the August rally back towards resistance.
📈 The Weekly Scenario of Cronos
Zooming into the weekly chart, we see the rally starting in November 2024, which pushed the price up to a high of 0.2353 USDT. From that level, the 2025 bearish phase began.

In this view, the consolidation phase between March and July 2025 is clearly visible, broken in July when $CRO broke above the range, triggering an acceleration that closed the month with a +70.52% gain.
⚔️ Battle Under Resistance
Subsequently, the move pushed $CRO to today’s high of 0.2360 USDT, once again testing the same resistance that had rejected the price between November and December 2024. A breakout of this area would open the way toward the next resistance around 0.2760 USDT.
As for support, in case of a rejection from resistance, the first relevant level of the August-to-date move lies in the 0.1770 USDT area.
🔍 For potential reversal signals, it will be necessary to monitor the daily chart, looking for technical patterns that could indicate a trend change.


