![Stellar Predictions: $XLM Price Projections [2026/2027]](https://www.publish0x.com/img/1173708.webp?action=resize&ar=1&enc=webp&inv=0&ori=1&st=1&up=1&w=1140&signature=762c323a6752247ace36ddc4449326f3c7ba40eff1f4c32aa4732b9262db1796)
The 2026 data indicates a market in 'wait-and-see' mode. On-chain activity remains high due to network utility, but this hasn't yet translated into price appreciation. XLM is currently testing deep liquidity zones, attempting to establish a 'higher-low' relative to historical bear market bottoms. Until a clear accumulation pattern emerges on the weekly chart, the risk of further sideways-to-downward movement remains the baseline scenario.
Historical Performance: From 2014 to the 2024 Exploit
Founded in 2014 by Jed McCaleb, Stellar ($XLM) has a history of high-volatility cycles. After its ATH of $0.9381 in January 2018, the asset entered long periods of price compression. Following a sideways phase that lasted from 2022 to late 2024, XLM experienced a massive breakout in November 2024, surging +469%—its best monthly performance since 2017. However, this peak at $0.6389 was short-lived, with a 36% correction in December breaking the critical $0.35 support.
The 2025 Retracement and Flash Crash
The bearish momentum intensified throughout 2025. Despite a brief +68.41% rally in July, the trend reversed in August, forming a series of lower highs. The October flash crash accelerated the decline, leading to a November low of $0.2166. Ultimately, Stellar closed 2025 with a significant -39.50% loss, failing to regain its previous support levels.
2026 Status: Searching for a Trend Reversal
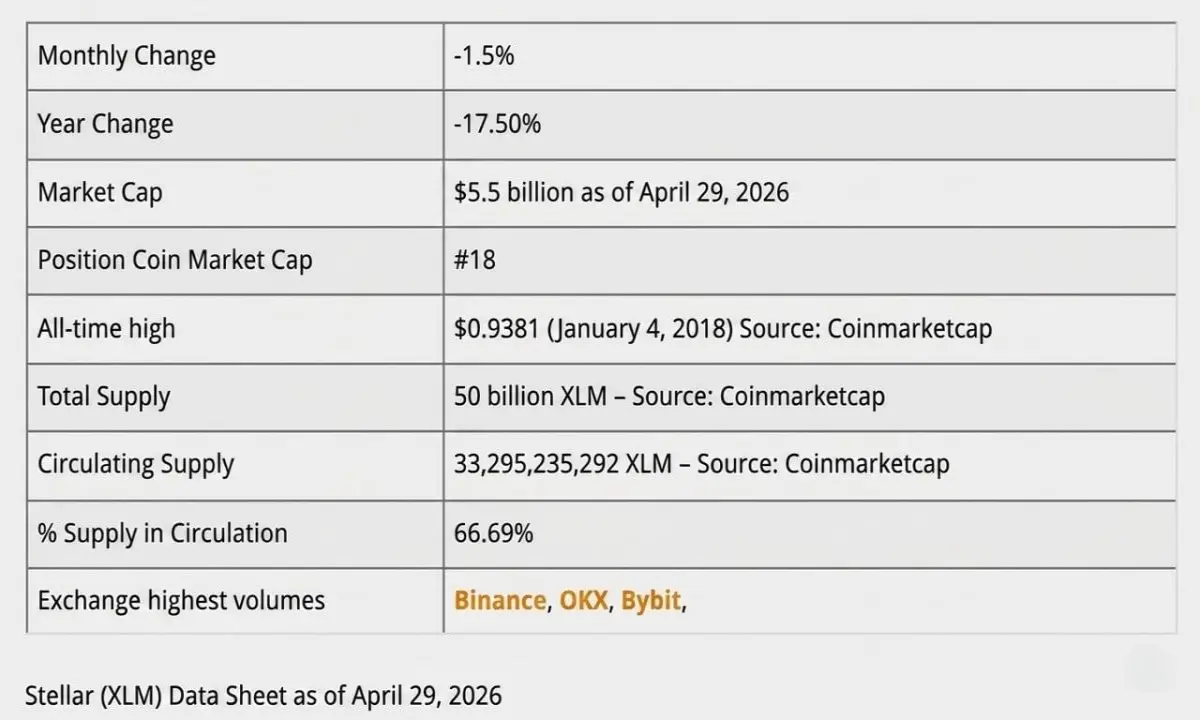
In 2026, the downward pressure continued, reaching a yearly low of $0.1361 in February. March provided the first glimmer of hope, closing in the green and breaking a streak of five consecutive red months. While April remains neutral, the year-to-date (YTD) performance stands at -17.50%. For a credible bullish signal, XLM must first reclaim and hold the $0.20 resistance zone.
Current Market Scenario: Stellar’s Volatile Path
Following the extraordinary surge in November 2024 (+469%), which allowed Stellar to close that year with a +157% gain, the asset entered a structural cooling phase. This correction persisted through early 2025, reaching a local bottom of $0.20 USDT in April. While a mid-year recovery saw a significant +68% jump in July, the momentum failed to hold, triggering a downtrend that resulted in a -39.50% yearly loss for 2025.
2026 Status: Volatility and Consolidation
The 2026 market remains characterized by high volatility and a prevailing bearish bias. Year-to-date, $XLM is down -17.50%. However, there are signs of stabilization: after a positive March (+5.40%) that broke a long losing streak, April has remained essentially flat. This 'neutral' behavior in April suggests that the aggressive selling pressure may be exhausting, as the price carves out a new narrow range.
$XLM: Historical Market Context
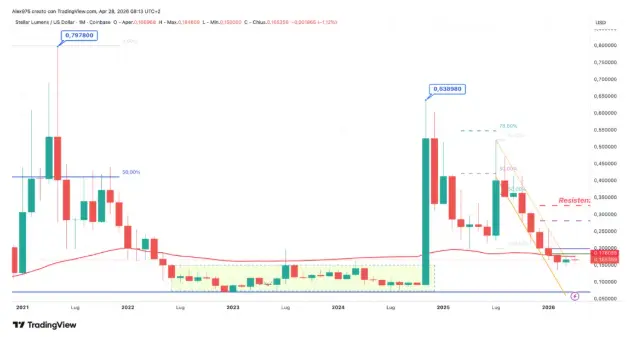
On the monthly chart, we analyze the price action of Stellar, one of the market's legacy assets founded in 2014 by Jed McCaleb and Joyce Kim. Historically, XLM’s performance has been defined by explosive rallies followed by sharp bearish swings and prolonged phases of price compression. The most recent sideways phase (highlighted in the yellow box) lasted from June 2022 until November 2024, when the asset finally broke out amid a broader market rally.
The November 2024 Exploit and the December Pivot
November 2024 marked a historic milestone for XLM, with a monthly surge of +469%—its strongest performance since May 2017 (+601%). During this peak, the price reached a yearly high of $0.6389. However, this momentum was immediately met with aggressive selling pressure, resulting in a 36% drop by the end of December. Critically, this downward move caused a breach of the $0.35 USDT key support, shifting the technical bias back to a defensive stance.
Stellar (XLM): From the 2025 Flash Crash to the 2026 Support Test
The bearish momentum persisted through the early months of 2025, with XLM hitting a local bottom of $0.20 USDT in April. This level triggered a significant relief rally, peaking in July with a +68.41% surge. However, the trend reversed sharply in August (-12%), initiating a pattern of lower highs. This decline accelerated during the October flash crash, leading Stellar to conclude 2025 with a steep -39.50% annual loss.
2026: Searching for Stability
The downward trend continued into 2026, reaching a multi-year low of $0.1361 in February. March provided a minor reprieve with a +5.21% close, breaking a streak of five consecutive red months. While April price action has remained flat, the Year-to-Date (YTD) performance stands at -17.50%.






