
Stock Markets Rally. S&P 500 near Highs, VIX Declining. Crypto Stalling on Resistances. Watch BTC and RSI Indicator.
The trend of American indices seems to have signaled the end of the Iran – USA conflict, as they continue to rise and the S&P 500 is just under 0.40% away from its historic all-time high of January at 7,043 points.
The cryptos started to experience suffering yesterday upon reaching their respective resistances. Ethereum recorded a contraction of -1.98% and Bitcoin -0.36%. Similar patchy behavior for the majority of tokens.
Crypto under pressure as stock indices rise
In reality, there is no formal agreement between the United States and Iran, with tensions remaining high and the blockade of the Strait of Hormuz still in effect. The US military blockade, launched on April 12 following the failure of negotiations in Pakistan, remains operational; however, vessels linked to Iran, including a Chinese tanker, have nonetheless crossed the strait. Despite this, the temporary two-week truce remains in force, and new talks between the USA and Iran are being considered, with Qatar's involvement.
Oil prices are declining on expectations of dialogue
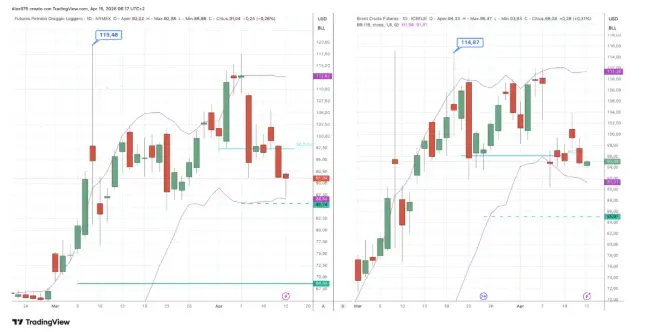
Futures Petrolio WTI e Brent – daily del 15 aprile 2026
In this scenario, oil prices have also recorded a decline. WTI futures yesterday fell by -7.87% and are currently trading at 90.90 dollars per barrel. Brent dropped by -4.60% and is now quoted at 95 dollars per barrel.
These declines are driven by expectations of dialogue between Iran and the USA, which are reducing the geopolitical risk premium that had previously supported the rallies. In the background, however, energy issues persist for numerous Asian countries, along with a reduction in jet fuel stocks for airlines.
S&P 500 nearing its all-time record
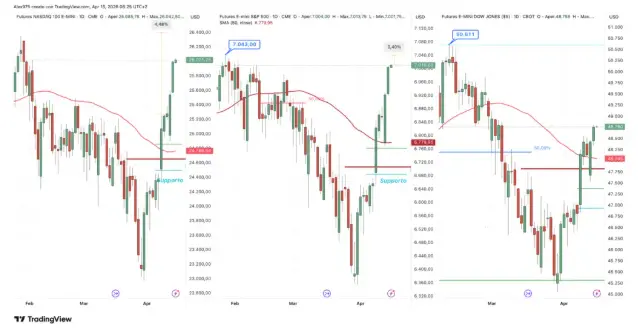
Nasdaq – S&P 500 – Dow Jones 15 april 2026
Stock markets are betting on a possible end to the conflict, and the S&P 500 future is nearing its all-time record of 7,043 points. It is currently positive in overnight trading and, at the time of writing, stands at 7,010 points. The Nasdaq and Dow Jones are also positive, though they remain further from their respective all-time highs. European indices are recording more modest gains. The VIX is in freefall, currently at 20.35 points.
Bitcoin Stalled at Resistance
Analyzing the Bitcoin (BTC) daily chart, currently trading at 74,300 USDT, it is evident that the price has stalled once again at the 74,500 USDT resistance, which blocked the rally in March. This vector resistance level corresponds to the 38.2% Fibonacci retracement of the move from the 2026 high to the low.
Beware of the Shooting Star
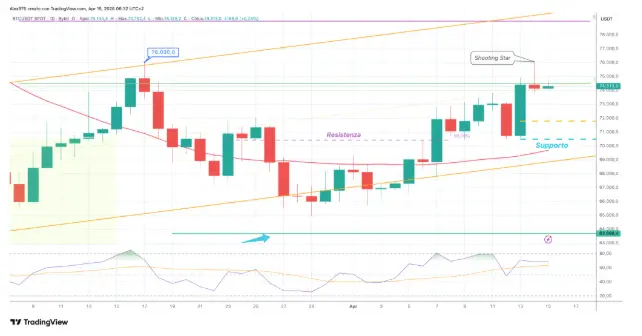
From a technical standpoint, a Shooting Star candle—a typical reversal pattern—formed yesterday right at a resistance level. Today, BTC is substantially unchanged. To invalidate this potential reversal pattern, the price would need to close today at yesterday’s candle highs recorded at 76,050 USDT, which also broke the relative high of March. On the short side, the first support level sits in the 71,820 USDT area, while the main support is at 70,500 USDT.
Ethereum Technical Price Scenario
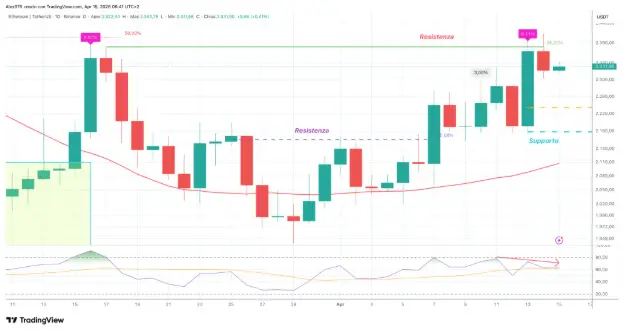
A similar situation is unfolding for Ethereum, which is currently trading at 2,330 USDT. Yesterday, the price stalled at the 2,380 USDT resistance, which had already halted the rally back in March. However, ETH also recorded a new relative period high yesterday at 2,415 USDT. The difference compared to BTC is that ETH saw a sharper decline yesterday and did not form a typical reversal candle; nevertheless, it remained below the resistance level.
In this scenario, the first support for ETH is in the 2,235 USDT area, while the main support is located at 2,178 USDT.
RSI Divergence for Bitcoin and Ethereum
Regarding the signals from the RSI indicator, a divergence is currently underway for both BTC and ETH. During the rallies two days ago, the indicator failed to record a high superior to that of the previous days for either asset. This represents a clear signal of weakness.






