
The week for the crypto market closed on a positive note, as did the entire month of April, despite the ongoing conflict between Iran and the USA. On Friday, a reopening of the Strait of Hormuz was announced; however, it underwent a new closure yesterday. Since crypto markets operate 24/7, they immediately suffered a price contraction, while oil traded on Hyperliquid experienced a surge.
New Hormuz Closure Halts April’s Crypto Rally
Iran has once again closed the Strait of Hormuz, blocking the passage of oil tankers and leaving hundreds of vessels stranded in the Gulf. This decision comes in response to the naval blockade of Iranian ports imposed by the United States, which Tehran has labeled a violation of the ceasefire. IRGC (Revolutionary Guard) patrol boats opened fire on several ships, significantly escalating regional tensions. In parallel, Trump has issued an ultimatum: if no agreement is reached by April 22, the United States could resume strategic bombings.
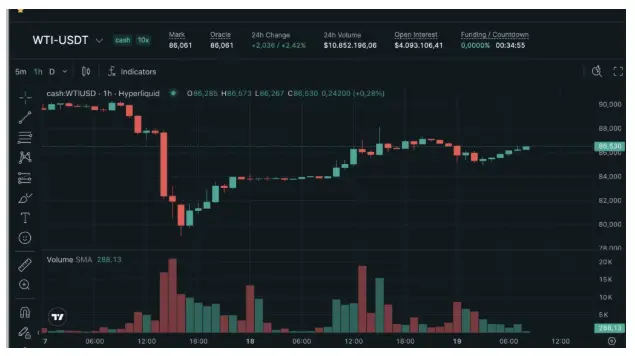
The price of oil has experienced a surge, as observed on the Hyperliquid platform, where it is traded 24/7, even during the weekend. We report the 1H chart, which shows how the price accelerated and returned to a quote of 86.55 USDT.
Top 20 Crypto Performance in April
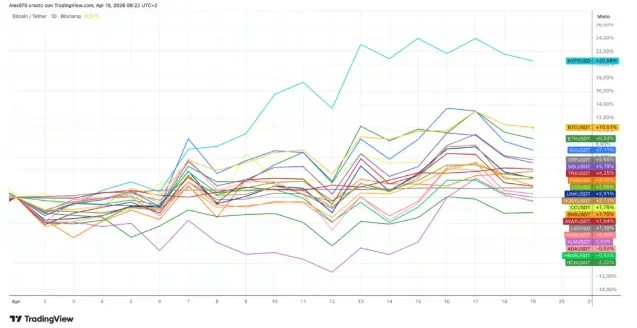
The month of April is showing a positive trend for the majority of the Top 20 tokens. The charts show a generalized stall following yesterday's events. On a monthly basis, Hyperliquid leads the rally with a +20.20% gain, followed by Bitcoin at +10.60%. Following them are Ethereum, SUI, and the others. Currently in negative territory are Bitcoin Cash, Hedera, and Cardano."
SUI stalls following Hormuz closure
Until yesterday, SUI was among the tokens recording the highest gains, alongside BTC. It is currently trading at 0.9422 USDT, up +6.80% in April, while on a year-to-date basis, it remains down by -32.80%.
SUI Weekly Chart Overview
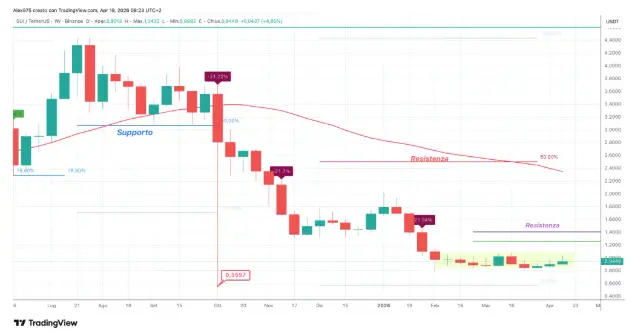
The weekly chart provides an overview of SUI's price action, starting from the highs recorded last summer at 4.4436 USDT and the subsequent contraction phase. This phase saw a bearish acceleration during the October flash crash, hitting a low of 0.5597 USDT, followed by a rebound. SUI then resumed its decline, closing 2025 with a total loss of -66%.
SUI Performance in 2026
The beginning of 2026 saw a brief attempt at a rally in the first week before the downward trend resumed. Looking at the last two months, the price has entered a congestion area (highlighted on the chart), which is effectively serving as a base. To signal a true recovery, SUI must at least reach the first annual vector resistance at 1.265 USDT, and subsequently attempt a push toward the 1.40 USDT resistance zone. A breakout of this level would confirm the strength of the reversal attempt.
SUI Short-Term Scenario
On the daily chart, focusing on the last two months and the related congestion, it is evident that the price is spending most of its time within this box range, where it remains positioned currently.
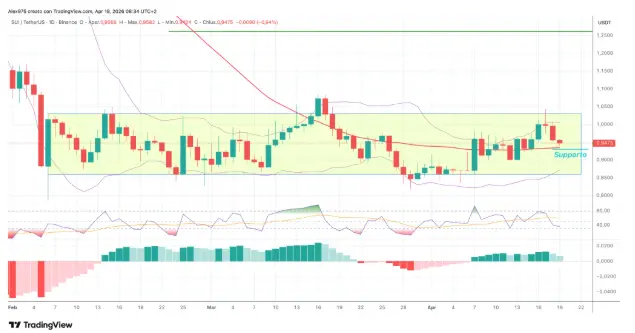
Yesterday, SUI recorded a drop of -4.04% and is currently sitting just above the 50-day SMA and the vector support at 0.93 USDT. A break below this level could drive SUI back toward the lower boundary of the box range.
The Fast RSI is highlighting market weakness but has not yet reached the overbought zone. Meanwhile, the MACD maintains a positive histogram, though it shows clear contraction with decelerating bars. This combined reading suggests a stagnation phase within the current box range.






