
Following the potential end of hostilities between Iran and the USA, stock indices and crypto markets are heading toward a positive weekly close. However, the end of the conflict remains hypothetical, as a new closure of the Strait of Hormuz was triggered yesterday, causing crypto prices to pivot downward. In this scenario, Ethereum is recording a +7.40% weekly gain with a +12% increase in April. Nevertheless, it remains in a contraction of -20.50% since the beginning of 2026.
Ethereum marks +12% in April
The historical monthly returns of Ethereum offer interesting insights to frame the current market phase. Attached is the Cryptorank table, which shows how April 2026, with a gain of 12.40%, aligns perfectly with the historical median for the month of 11.8%, confirming a positive seasonality observed in seven out of ten years.
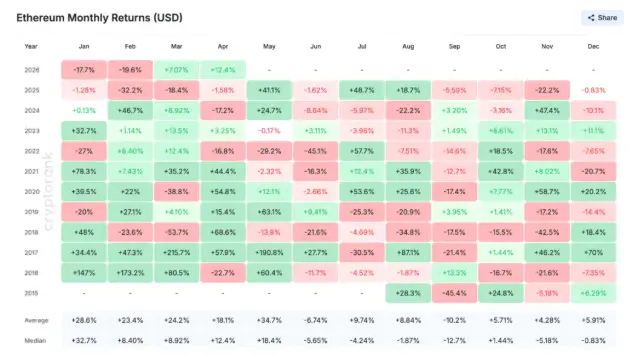
Historically, May is the strongest month of the year
Even more significant is the data for May, historically the strongest month for ETH, with a median return of 18.4% and eight positive closes out of eleven total readings. Conversely, September remains the only month with a clearly negative median of -12.7%, showing recurring seasonal weakness over the years.
It must be noted that the available sample covers only eleven years and is skewed by the bull runs of 2017 and 2020-2021. Therefore, medians are more reliable than averages. This type of statistical analysis is useful as context, but not as a standalone trading signal.
Ethereum: A green April historically weakens May
To complicate the statistical outlook, in years when April closed positive, the following May recorded a median of only 5.97%, with only three positive months out of six total available cases.
Historical data for May, historically the strongest month
The historical general data for May, considered the strongest month of the year, indicates instead a median return of 18.4% and eight positive closes out of eleven readings. Therefore, a green April statistically seems to reduce May's push, not amplify it, as one might hypothesize.
2026 also represents a unique case in Ethereum's observable history. Never before had January and February both closed in strong negative territory, followed then by March and April both positive in the sample.
Ethereum Weekly Overview
Moving to ETH's performance on the weekly chart, one observes an overview of the downtrend started from the April lows of last year at 1,385 USDT and the following bullish leg that pushed ETH to the high of 4.955 USDT touched in August. From here, it then began the long downward phase with a series of bearish accelerations.
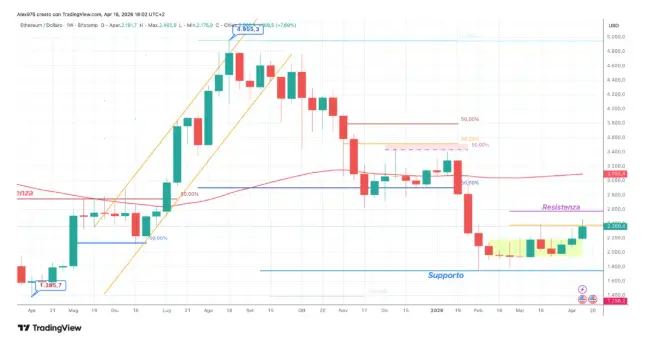
In December, ETH formed a base in the support area of 2,900 USDT, which was subsequently broken in mid-January 2026 during a bearish acceleration that led to a low of 1,742 USDT. From this bottom, a rebound phase began, leading to a congestion period that lasted 9 weeks.
ETH Toward the 2,380 USDT Resistance The week now coming to a close seems to have triggered a breakout from that congestion, with the price returning to the first vector resistance at 2,380 USDT. This level corresponds to the 38.2% Fibonacci retracement of the vector moving from the annual high to the annual low. Currently, the price is testing this level from below. The main resistance, however, sits in the 2,600 USDT area.
Ethereum Short-Term Scenario
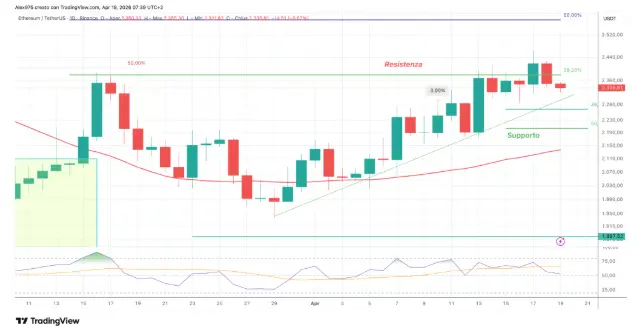
The daily chart of Ethereum provides an overview starting from the previous March high recorded at the 2,380 USDT resistance. From that point, a retracement phase led to a low of 1,938 USDT, which triggered the April rebound characterized by a series of higher highs and higher lows.
Yesterday, ETH closed with a contraction of -2.33%. Currently, it faces a first short-term support area at 2,260 USDT, while the most significant support lies in the 2,200 USDT area. A breakdown of this level could lead to a possible bearish acceleration toward the 2,100 USDT zone, where the 50-day SMA (Simple Moving Average) is also positioned.






