
Among the altcoins performing best in recent hours is a relatively new token — Ethena (ENA) — which is currently trading at 0.7197 USDT.
In August, Ethena is up +26.60%, following its +113% rally in July. However, since the start of the year, it still shows a negative performance of -20.80%.
The $ENA token, launched in April 2024, has grown by about 600% over the past year. It currently has a market capitalization of $4.83 billion, placing it at #30 in CoinMarketCap’s ranking.
USDe: Ethena’s Stablecoin
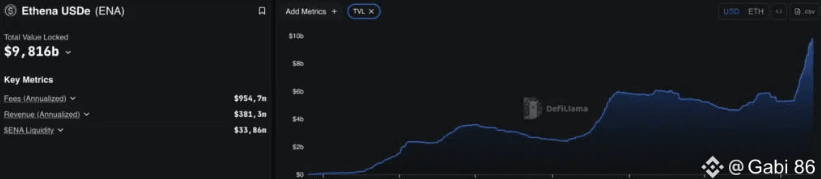
Ethena is the protocol behind the issuance of the stablecoin USDe, which has reached a market cap of almost $10 billion in about 18 months, according to a chart from specialized site DefiLlama.
USDe is a synthetic stablecoin, pegged to ETH and BTC and balanced with short positions in derivatives.
Historical Overview of Ethena

Ethena recorded its all-time high (ATH) at 1.52 USDT shortly after its April 2024 listing. On the weekly chart, we can see last year’s movement: in the summer, its price collapsed to 0.1940 USDT in September 2024.
From that low, a rally began, accelerating in November and pushing the price to a December peak of 1.33 USDT.
The 2025 Crash and Recovery
In early 2025, ENA’s price suffered another crash, hitting its yearly low at 0.2225 USDT in June. The chart shows that between April and May, the bearish phase had already begun to lose momentum.
From the June low, a rally started that has so far delivered a +225% gain in seven weeks.
Key Resistance and Breakout Scenario
The $ENA price is now targeting the 0.77 USDT vector resistance area, already highlighted in our July 31 analysis:
“The main resistance remains at 0.77 USDT.”
— Alessandro Lavarello, professional trader and analyst at Criptovaluta.it
This level corresponds to the 50% Fibonacci retracement, calculated from December’s high to June’s low.
A breakout above this resistance could open the way for renewed strength in ENA, potentially starting a bull market phase.
Short-Term Analysis of Ethena

On the daily chart, the rebound from June’s low is clearly visible. After a first consolidation phase in mid-July, the uptrend accelerated with increased volatility.
In late June, a first correction brought the price down to the 0.52 USDT support area — also identified in our July 31 analysis. From there, another rebound began, with today’s daily candle showing a +12–13% increase.
Technical Indicators
In the lower part of the chart, the RSI is entering the strong (overbought) zone, confirming the current uptrend.
It’s worth noting that overbought does not automatically imply a trend reversal, contrary to what is often assumed.


