
Bitcoin’s rally has hit a major roadblock at the 79,000 USDT resistance level, while Ethereum faces a sharper retracement. Market sentiment remains on edge as the expiration of the US-Iran ceasefire yesterday (April 23) has reignited fears of a maritime blockade in the Strait of Hormuz, driving investors toward defensive assets.
Crypto Slowdown and US Indices Stalled at Highs
Crypto markets and stock indices have entered a phase of transition and waiting after the strong rally of recent weeks. While US indices are stalling at their all-time highs, the crypto sector has seen initial breakdowns over the past 48 hours. Yesterday, Bitcoin closed flat, while Ethereum recorded a -1.85% decline.
Hormuz Tensions Escalate Amid Diplomatic Efforts
Confrontation between Iran and the US in the Strait of Hormuz has intensified. Following the seizure of the tanker Touska, Tehran has reportedly targeted commercial vessels, leading to a persistent US naval blockade. Meanwhile, diplomatic talks in Turkey are underway; Iran is considering a ceasefire as a negotiating base, demanding an end to sanctions. In this volatile climate, Brent Crude remains steady at $100 per barrel, with WTI trading just below $96.
US Indices at Records, Crypto Slows Down
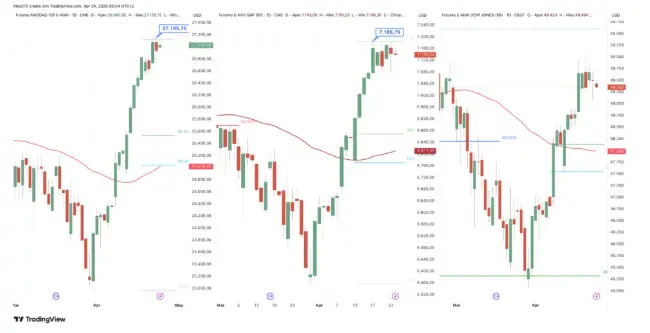
A divergence has emerged between crypto and equity markets over the last 48 hours. The Nasdaq hit a new future high at 27,155.75 points yesterday before closing down -0.55%, while the S&P 500 declined by -0.40%. The VIX rose to 20.70, signaling growing caution. In Asia, the Nikkei remains near all-time highs, and the Kospi reached a new record high. Meanwhile, Bitcoin is stalled below the 79,000 USDT resistance; after peaking at 79,472 USDT, it failed to hold the level and is currently trading at 77,616 USDT (-0.82%).
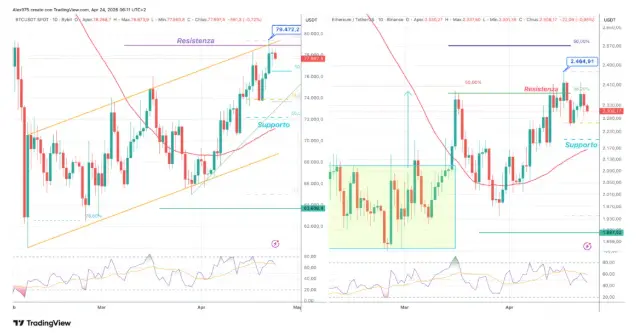
On the Bitcoin daily chart, the price is stalling not only at horizontal resistance but also against the upper boundary of the orange ascending channel. The immediate short-term support to watch is at 76,500 USDT, followed by a secondary level at 73,900 USDT.
Ethereum exhibits significantly more weakness; it failed to print a higher high relative to last week's peak of 2,464 USDT. After yesterday's -1.85% slide, ETH is currently trading at 2,304 USDT (-1%), having already broken its short-term support. It is now heading toward the 2,260 USDT support zone, with the primary support level sitting at 2,200 USDT, near the 50-day SMA.
Candle Sequence Analyzer: Bearish Bias Emerges
The Candle Sequence Analyzer reveals underlying weakness for both BTC and ETH. The current bullish-doji-bearish sequence for Bitcoin carries a win rate of only 28.1% and a score of 0.86, signaling a bearish bias. Notably, this combination stands out as the only bearish signal among the top ten strongest patterns in the global rankings.
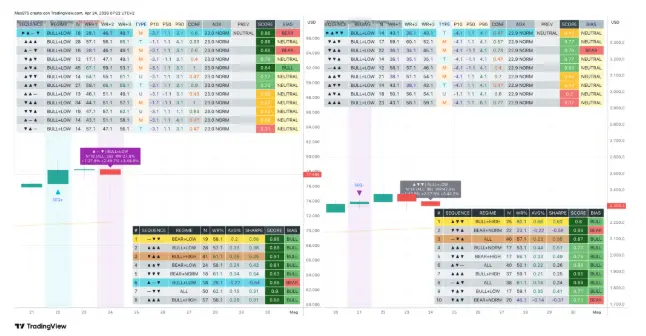
Ethereum also reflects a weak technical context, with a bullish-bearish-bearish sequence showing a 43.1% win rate and a 0.43 score. In summary, while ETH provides clear indications of weakness, the historical data for Bitcoin signals a significant risk of a negative close for today's session.






