
Market Watch: Diplomacy in Islamabad vs. $100 Oil
The Islamabad Channel: Iran’s 10-Point Proposal
Financial markets enter another week of cautious anticipation as diplomatic efforts intensify through Islamabad. Tehran has reportedly advanced a 10-point peace plan mediated by Pakistan, which proposes a conditional reopening of the Strait of Hormuz, an extension of the current ceasefire, and a temporary deferral of the nuclear dossier. As of this morning, Washington has yet to issue a formal response, leaving the 'fragile balance' between the two nations as the primary driver of market volatility.
Crypto Rally Hits a Wall Amidst Energy Pressure
The crypto market saw a bullish surge overnight, with Ethereum closing up +2.15% and Bitcoin up +1.34% yesterday. However, the momentum slowed in the early hours of Monday as several tokens slipped into the red. This 'cooling off' coincides with Brent crude stabilizing around the $100-$108 per barrel range. Despite the ongoing ceasefire, the naval blockade of Iranian ports remains a significant bottleneck, keeping energy prices elevated and capping the upside for risk assets.
US Futures at Record Highs
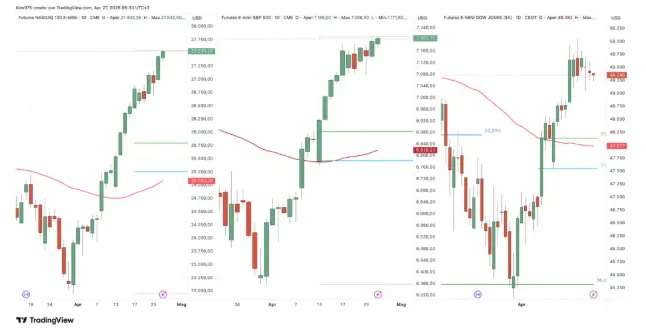
Global markets reacted positively to the overnight opening, with S&P 500 and Nasdaq 100 futures climbing into the green and touching new all-time highs (ATH). While the rally remains measured, it reflects a dominant 'risk-on' sentiment fueled by geopolitical optimism. In contrast, the Dow Jones saw a slight dip, while European indices followed the positive trend. The primary focus this week is the final Federal Reserve meeting chaired by Jerome Powell, following the official dismissal of the U.S. Department of Justice charges against him.
Bitcoin: Testing the Vector Resistance at $78,000
Cryptocurrencies are extending their April bullish trend. After a low-volatility weekend, a sharp upward acceleration last night pushed Bitcoin (BTC) to $78,000 USDT. The price is currently hovering just below the primary vector resistance that capped gains last week. A decisive break above this level could clear the path for a direct assault on the $80,000 psychological barrier, supported by the easing of domestic regulatory pressures on the Fed leadership.
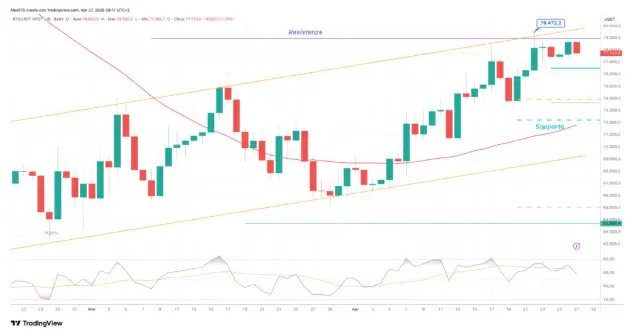
On the daily chart, Bitcoin has spent the last five sessions consolidating just below the $79,000 USDT level. Today’s price action marks another aggressive attempt to reclaim this resistance. April has been a standout month with a +14% rally, successfully erasing the February crash. However, from a Year-to-Date (YTD) perspective, BTC remains -10.50% in the red, highlighting the significance of the current recovery phase.
Support Levels and Momentum Indicators
To maintain the current bullish structure, the primary support zone to watch is $76,600 USDT. On the momentum side, the Relative Strength Index (RSI) is crossing back above its moving average. Crucially, the RSI remains below the overbought threshold, suggesting there is ample 'room to run.' A definitive breakout above current resistance could trigger an extension toward the medium-term target of $85,000 USDT.
Ethereum: The Struggle Below Resistance
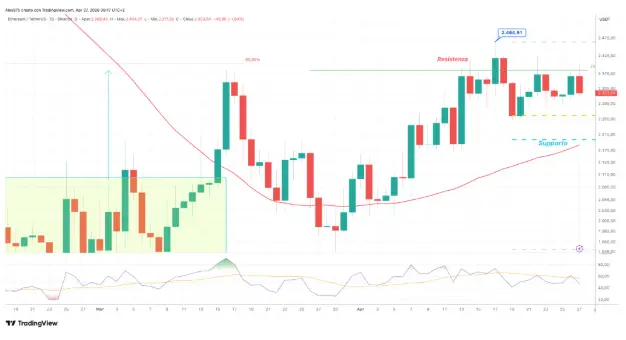
Ethereum (ETH) remains relatively weaker than Bitcoin, currently trading at $2,334 USDT. The price is hovering just below its first primary vector resistance. A look at the daily chart shows that the $2,380 level successfully rejected the price about ten days ago. To date, ETH has failed to record a higher relative maximum, maintaining a cautious technical structure.
The Path to $2,600 and RSI Momentum
A daily close above $2,380 is essential to confirm a shift in momentum and signal a target toward the major resistance zone at $2,600 USDT. From a technical perspective, the RSI (Relative Strength Index) has crossed above its moving average and remains well below the overbought territory. This suggests that, much like Bitcoin, Ethereum has significant 'room to run' once the initial resistance is cleared.
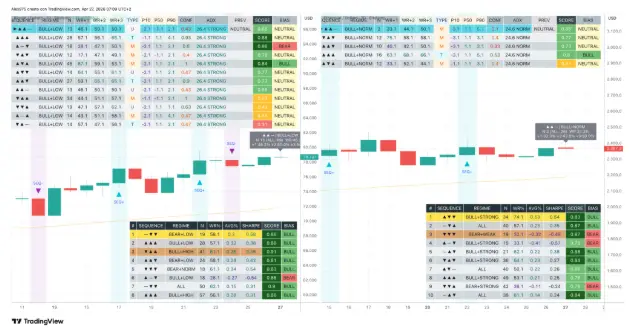
The Candle Sequence Analyzer provides a robust and consistent statistical framework for both BTC and ETH. Bitcoin has successfully closed three consecutive bullish candles with a conviction score of 0.88 and a third-day persistence probability of 65.1%. Ethereum mirrors this sequence with a score of 0.80, maintaining a clear bullish bias within the current market structure.






