
The cryptocurrency ecosystem is experiencing a severe downward expansion, booking heavy losses across weekly and monthly timeframes. Bitcoin (BTC) has shed approximately -5.00% over the rolling seven-day period, while Ethereum (ETH) has retreated by -5.70%, signaling a widespread phase of structural weakness that is dragging down the broader altcoin market.
This overnight liquidation wave has flushed out near-term leveraged positions, shifting short-term momentum oscillators into bearish territory.
The Macro Divergence with Wall Street "In contrast to the digital asset sell-off, traditional equity matrixes are moving in the exact opposite direction. U.S. stock indexes continue to demonstrate aggressive bullish resilience, highlighted by the Dow Jones Industrial Average printing a fresh All-Time High (ATH) during yesterday's trading session.
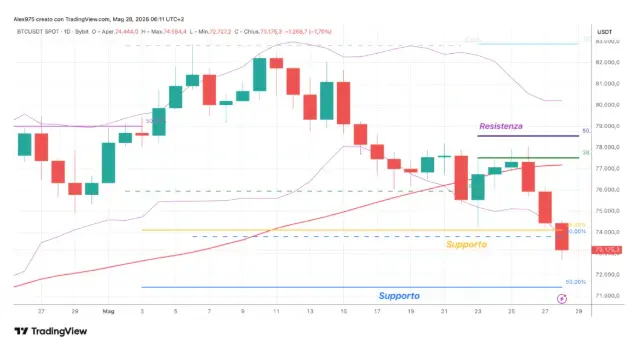
Bitcoin Breaches Critical 74,000 USDT Support Confluence Zone
At the time of writing, Bitcoin (BTC) is trading at 73,150 USDT, locking in a -4.00% negative return for the month of May.
A granular analysis of the daily chart isolates a major structural shift: price action has officially executed a bearish breakdown below a critical support zone spanning between 74,000 and 73,800 USDT.
On paper, this specific range represented an exceptionally strong confluence floor, as it marked the precise intersection of two distinct vector support systems: the ascending demand line tracking the April corrective recovery, and the primary macro trendline anchored to the February market bottom.
Bitcoin Eyes Macro 71,000 USDT Fibonacci Floor as Ethereum Collapses Below 2,000 USDT
Within this bearish short-term scenario, the most significant macro defense line for Bitcoin (BTC) rests firmly at 71,000 USDT. This specific level aligns precisely with the 50% Fibonacci retracement measured from the current year-to-date low to the annual high.
From a historical and quantitative perspective, a monthly close in the red for May would register a bearish statistical signal, potentially disrupting the historical structural performance metrics typically observed during this period of the halving cycle.
Ethereum's Structural Breakdown and Liquidity Vacuum "The market architecture appears significantly more compromised for Ethereum (ETH), which is currently trading at 1,975 USDT, booking a heavy month-to-date decline of -12.57% for May.
The overnight liquidation wave forcefully broke below ETH's primary 2,100 USDT vector support, plotted across the annual high-to-low price matrix.
What makes the current setup critical is the absolute velocity of the breakdown below the 2,000 USDT psychological handle. Price action sliced through this major liquidity cluster without triggering any immediate buyer absorption or absorbing bid walls, signaling a temporary vacuum of institutional market makers and active order flow inside the order books.
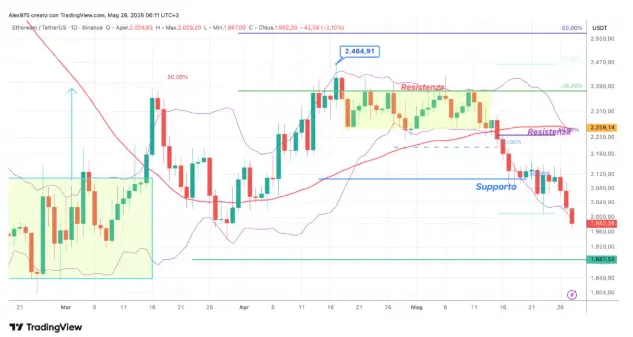
A technical review of the chart isolates the next logical downside objective for Ethereum (ETH) in the 1,885 USDT zone.
Crucially, situated just below this horizontal handle lies the historical accumulation base that characterized ETH’s protracted congestion phase from February through mid-March. This specific high-volume node is expected to act as a significant structural buffer, where institutional limit orders may step in to absorb the current localized selling pressure.
Top 20 Weekly Performance Heatmap "The broader rolling seven-day performance matrix across the Top 20 digital assets highlights systemic weakness, with only a few isolated exceptions breaking away from the bearish trend.
Stellar (XLM) leads the market with an impressive +16.00% rally, trading in complete divergence from the macro environment. The only other large-cap assets sustaining positive territory are Toncoin (TON) and Tron (TRX). Conversely, the remainder of the Top 20 matrix remains firmly locked in negative territory, confirming a comprehensive capital flush across the altcoin landscape.
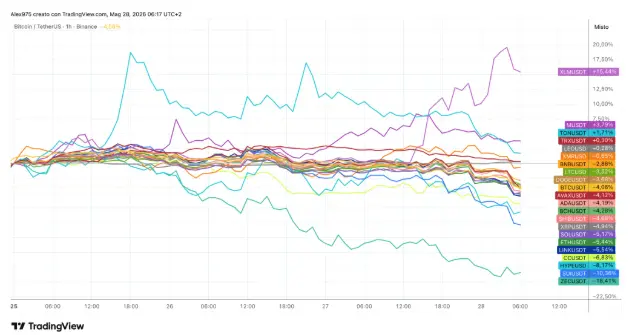
t the bottom of the digital asset matrix, the downside expansion has turned increasingly aggressive. Legacy privacy asset Zcash (ZEC) has collapsed by approximately -18.00%, signaling heavy capitulation.
Simultaneously, major high-throughput networks and decentralized infrastructure pillars like Sui (SUI) and Hyperliquid (HYPE) are shedding roughly -8.00%, confirming that the liquid capital flush is aggressively targeting even the strongest sector narratives.
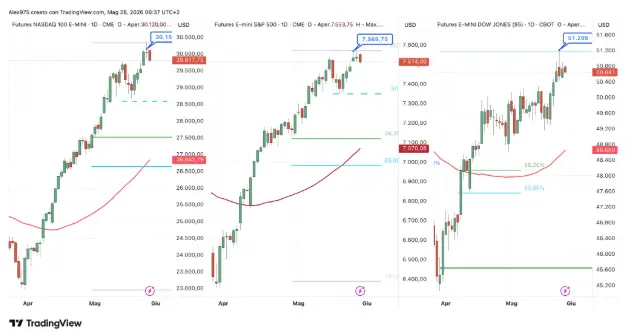
Macro Equity Decoupling Facing Global Realignment "The most persistent structural theme remains the stark decoupling between digital assets and traditional equity matrixes. During yesterday's session, the Dow Jones Industrial Average futures printed a fresh All-Time High (ATH) at 51,209 points. While Wall Street's cash close was mixed, major indexes sustained tight consolidation patterns immediately underneath their historical ceilings.
However, this divergence may face an immediate stress test: current pre-market openings for the S&P 500, Nasdaq, and Dow Jones have flipped into negative territory, mirroring a sharp overnight distribution phase across Asian markets.
Global equity headwinds are intensifying, highlighted by South Korea's Kospi index plunging by -3.95% and Japan's Nikkei index retreating by -1.60%. This systemic global equity pause suggests that the overnight crypto liquidations may have acted as a leading liquidity indicator for a broader macroeconomic cooldown.
Wall Street Rotates to Cyclicals Despite Marvell’s Record $2.4B AI-Driven Earnings Beat
Marvell’s Hardware Outperformance and Fiscal Acceleration "The secular hardware deployment cycle surrounding artificial intelligence remains fundamentally robust. In its latest earnings release, Marvell Technology reported record Q1 fiscal 2027 revenue of $2.418 Billion, printing a +28.00% year-over-year expansion and beating Wall Street expectations.
Driven by aggressive booking momentum across its custom AI application-specific integrated circuit (ASIC) and data center portfolios, the company significantly upgraded its fiscal 2027 and fiscal 2028 revenue guidance.
Marvell projected a structural acceleration in order flow, citing an unprecedented backlog of AI-infrastructure deployment contracts. Despite this massive fundamental confirmation, the technology-heavy Nasdaq witnessed localized profit-taking, as institutional capital actively rotated into value and cyclical segments, driving the Dow Jones Industrial Average to outpace its tech-heavy peers.
PCE Inflation and Geopolitical Headwinds Front-Center "The broader macroeconomic matrix remains highly sensitive to upcoming regulatory and geopolitical data points. The global market session is heavily focused on the U.S. Personal Consumption Expenditures (PCE) price index release for April, the Federal Reserve's primary core inflation metric.
Scheduled for release alongside the second estimate for Q1 U.S. GDP and initial jobless claims, these data points carry heavy monetary policy weight.
Against a backdrop of lingering geopolitical tensions between Iran and the United States, a hotter-than-expected inflation print could reinforce the Federal Reserve's restrictive higher-for-longer interest rate framework. For the cryptocurrency market, which is already experiencing localized liquidity drains, an inflationary shock poses a major near-term risk of triggering an accelerated bearish expansion below standing support structures.
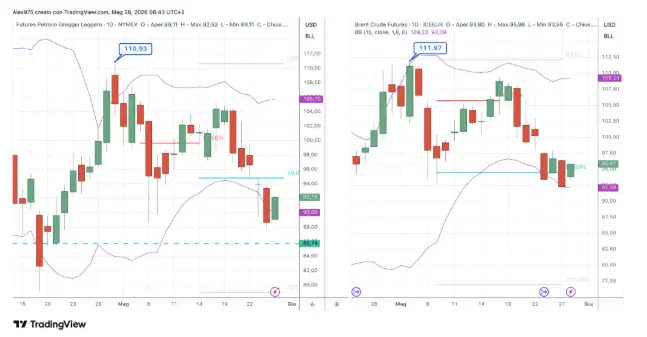
The global energy matrix is experiencing heightened volatility, with front-month WTI crude futures trading near the $90.00 per barrel threshold and Brent crude climbing to $92.06 per barrel.
The primary structural driver remains the escalating geopolitical friction along the United States-Iran axis, which directly threatens critical maritime chokepoints. Institutional energy desks are pricing in a significant risk premium tied to the security of oil tanker transits through the Strait of Hormuz, a vital passageway responsible for a substantial portion of global seaborne petroleum architecture.
Negotiation Deadlocks and Macro Uncertainties "Market uncertainty deepened following statements from Donald Trump, who declared he was 'not satisfied' with the initial diplomatic proposals submitted by Tehran.
This friction persists despite the emergence of a draft agreement that outlines a framework for the re-opening of the Strait of Hormuz within a one-month window. While high-level diplomatic negotiations remain active, they are currently in a structural deadlock.
A definitive, de-escalatory resolution remains contingent upon rigorous verification mechanisms of mutual concessions. For global macro and digital asset markets, prolonged energy supply-side constraints keep the threat of stagflation active, heavily weighing on risk asset valuations ahead of key central bank policy decisions.






