
GLASSNODE
Glassnode is a blockchain data that generates on-chain metrics and tools for users to look at Bitcoin and Ethereum from a different perspective. It can be used for obtaining more information which cannot generally be obtained from regular charts in coinmarketcap or trading view.
What is on-chain analysis?
It is the study of capital flow happening on the blockchain and the study of network metrics of the blockchain. Normally in tradional stock markets just the price and volume data is available to us. In a blockchain everything can be tracked so on-chain metrics can let us find out how many times the funds have been moved in or out and how much of a certain coin a particular address owns.
Glassnode Academy
A tutorial is available on their website on how to use and understand the various charts that are available and it can be found under the Academy section. Not all the available charts are free to use and the details about the prices can be found in the Pricing section. But for average investors the tools available are good enough. The ones that are in grey colour are free to use, the ones in blue are updated with delay and the reds ones are not accessible to a free user.

Under the Charts section on the top left you have a drop down menu where you can select the asset to be analyzed. Once you select the asset you can select the metric to be analyzed Addresses, Indicators, Account-based, Exchanges, Transactions, Markets, Entities, Supplies, UTXO, Fees, Mining, Blocks and Distribution. Each category has loads of charts that can be used to gain meaningful information.
ADDRESS CATEGORY
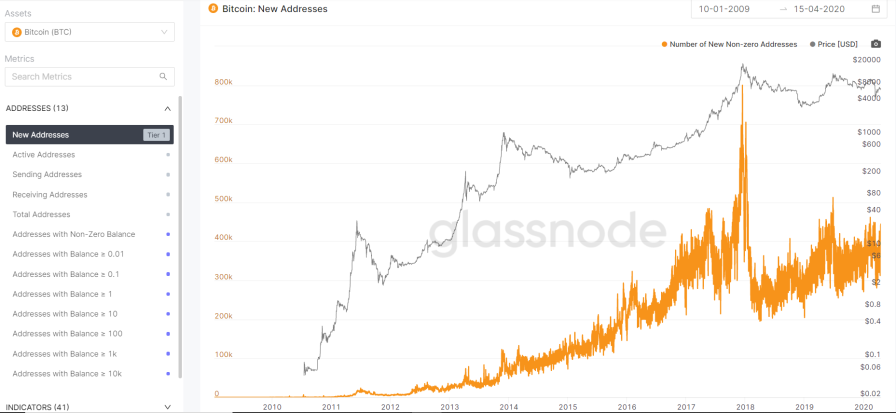
- The number of newly created addresses.
- How many of the available addresses are actually active.
- How many addresses are receiving, sending bitcoins on the blockchain and the total number of addresses on the blockchain network.
- Check the stats on how many addresses own how many fractions or whole numbers of bticoin.
INDICATOR CATEGORY
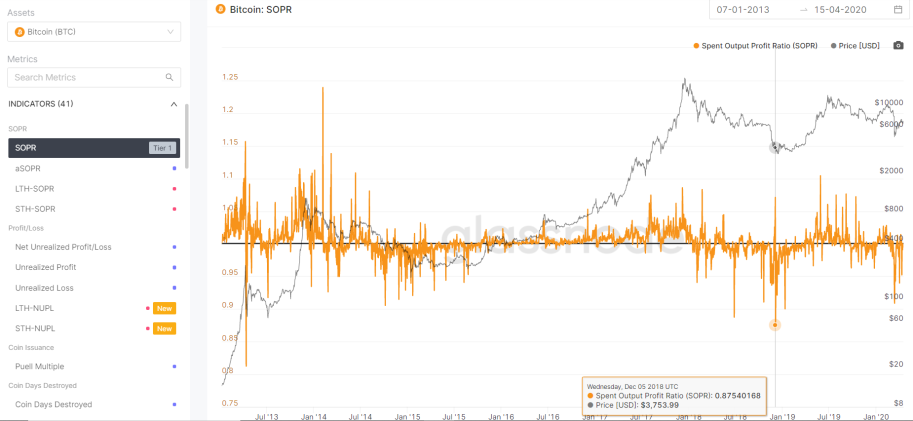
With 41 indicators to look at there are a hell lot of tools available to you and I'm sure you wouldn't have analyzed bitcoin in such a manner. There's lots to play around have gain knowledge.
ACCOUNT BASED CATEGORY
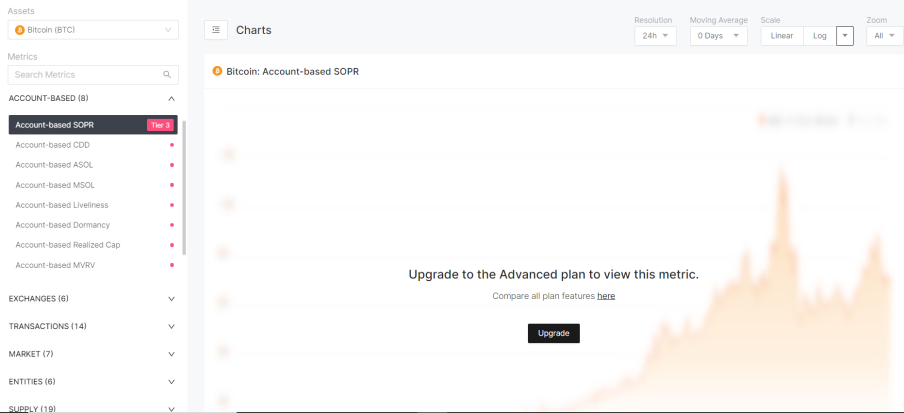
All the indicators under this category fall under the premium category and cannot be accessed by a free user. I think it is the data regarding particular accounts so I feel you can analyse your own account.
EXCHANGES CATEGORY

Under this category the information regarding the flow of bitcoins in and out of Cryptocurrency exchanges like Coinbase, Binance, Kraken etc are being tracked. The balance in the exchanges and the amount being deposited and withdrawn in and out of all the exchanges combined.
TRANSACTIONS CATEGORY
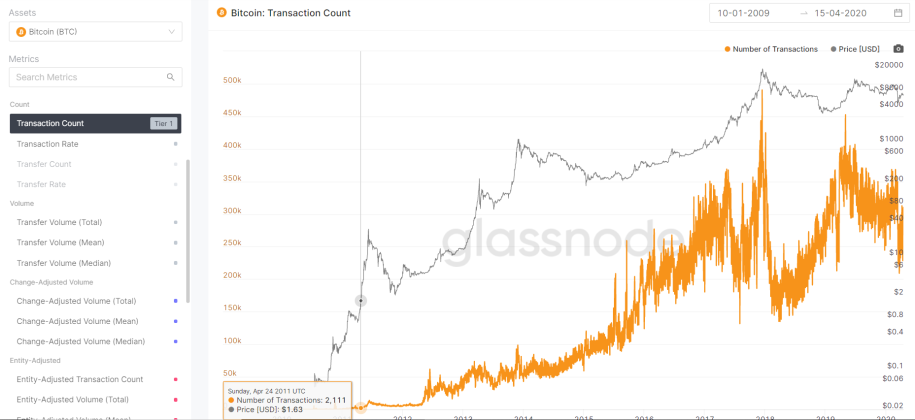
All information regarding the transactions that happen on the bitcoin blockchain can be monitored. The number of transactions and the rate at which the transactions occur can be measured.
MARKET CATEGORY
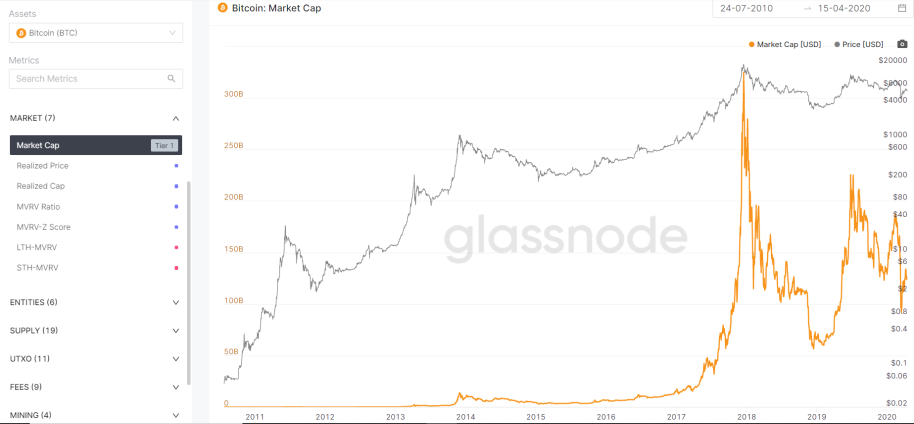
The data about the current market can been seen like the market cap, price and value.
ENTITIES CATEGORY
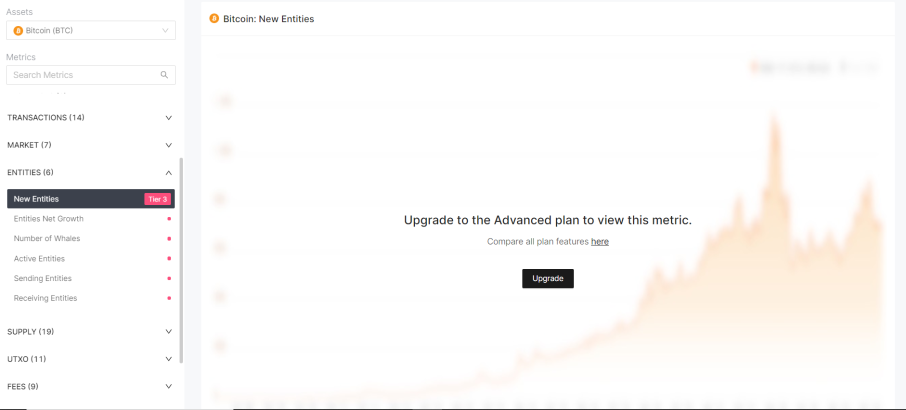
All the indicators under this category fall under the premium category and cannot be accessed by a free user. I think has to do with the accounts of Large entities (organizations, whales and institutional investors).
- The Total number of entities New/Existing and the ones that are active.
- The Entities that are sending and receiving bitcoins.
- The growth of a particular entity and the total number of whales.
SUPPLY CATEGORY
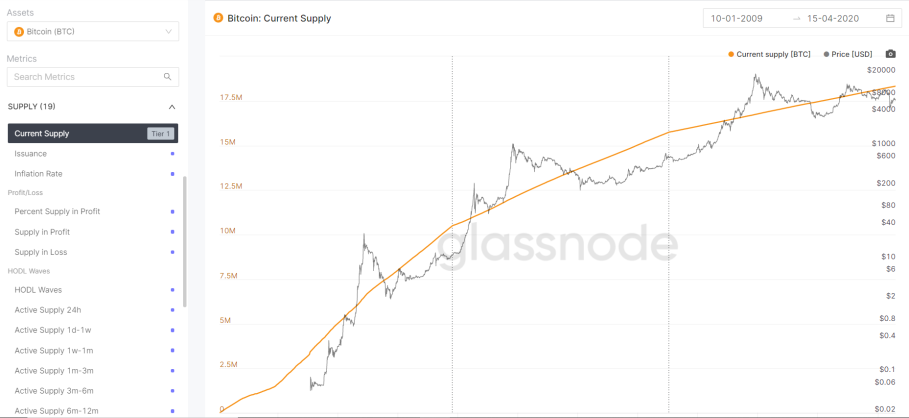
All information regarding the circulating supply of bitcoin, the amount of newly minted coins, the inflation rate of bitcoin, the profit/loss of the existing supply of bitcoin and the hodl information is available.
UTXO CATEGORY
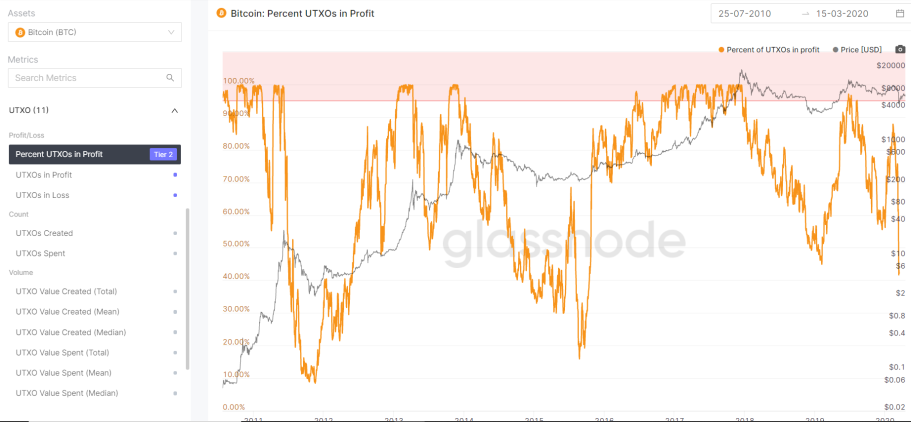
UTXO is nothing but the unspent amount in a bitcoin transaction. All the information regarding the unspent transactions can be found in this category. The percentage, profit, volume, loss and count can be analyzed.
FEES CATEGORY

The fee that are paid by the users to the miners for putting the transaction onto the block is nothing but the transaction fees. The total fees that are paid can be analyzed. In the case of Ethereum gas is used for transactions.
MINING CATEGORY
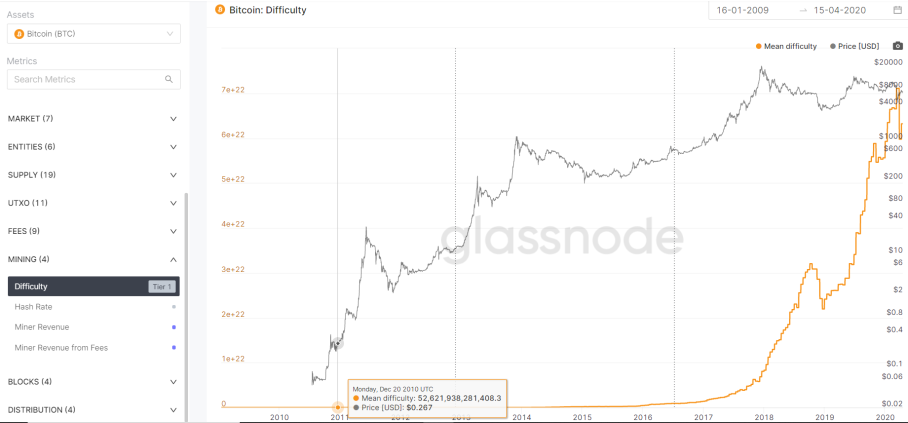
- Difficulty rate of the puzzle that miners are solving for adding transactions on to the block.
- The present hash rate of the bitcoin network.
- The revenue of the miners just from the transaction fees and in total with the rewards.
BLOCK CATEGORY
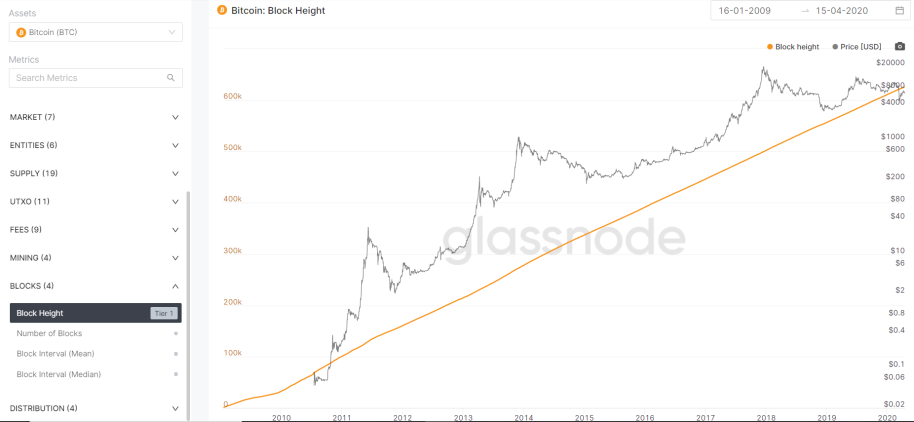
- The current block height that is being mined.
- The total number of blocks that have been added to the main blockchain.
- The mean and median time between the creation of two blocks.
DISTRIBUTION CATEGORY

The Distribution category contains information only about ERC-20 tokens. The percentage of supply that are locked in smart contracts, the top 1% of the richlist, the distribution of the ERC-20 token and how decentralized a token is can be visualised.
Now you guys have a new tool at your disposal. Go ahead and have fun analyzing the crypto you have invested in!


