
Bitcoin rallied a bit on Tuesday, initially pulling back into the low $13,000s before turning around, forming a hammer, and closing around $13,700. This is a bullish daily candle and indicates the trend in Bitcoin may not be ready to reverse just yet.
(November 3, 2020 8:00 PM EST)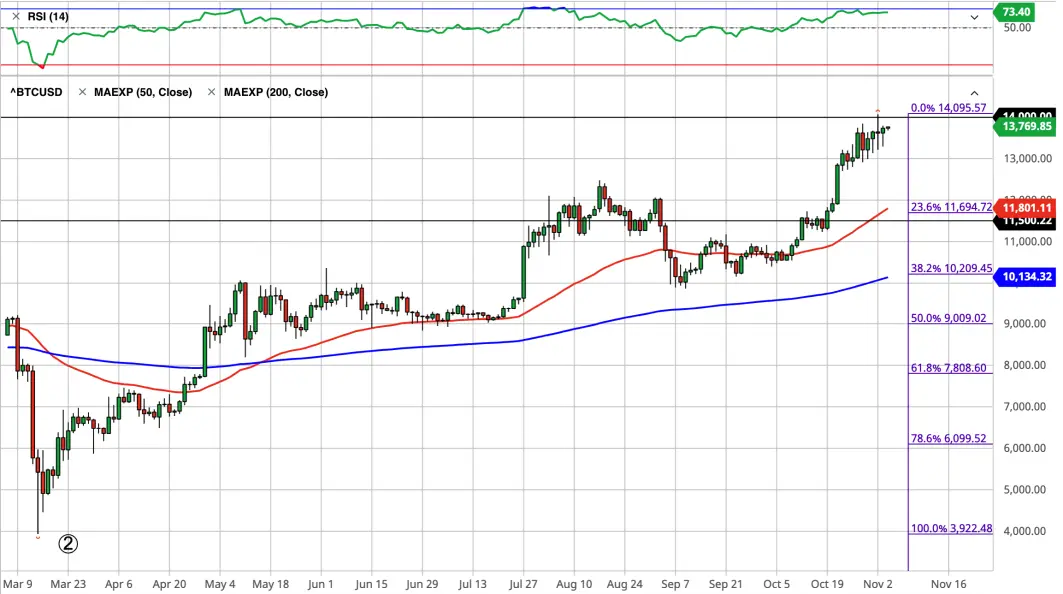
Outlook: Bitcoin initially dipped but recovered strongly with the buyers stepping in to buy the dip, printing a green hammer candle on the Daily chart and weakening yesterday's Doji candle. Bitcoin still seems to have tread on its tires and continues to grind higher towards the $14,000 level. As a matter of fact, you can see in the chart above that yesterday Bitcoin made a new local high, piercing the $14,000 level briefly before pulling back. We are at the top of a local ascending uptrend, but this is not the type of trend nor asset to short when Bitcoin is in a well-defined and powerful uptrend. Even if you expect weakness, which I think there's a case for as Bitcoin has found some choppy price action near $14,000, I am not a seller; this could go against you in a bigger way than most could probably handle; this is the sort of situation where you want to buy on dips.
A lot of investors and traders have exited long positions in other markets, raised cash, and even shut down their algo operations for at least a few days in anticipation of major market volatility. If there is a selloff, I think Bitcoin is likely to pull back to somewhere between the $11,000 - $12,000 level, which features a confluence of support with the 50 Day EMA, previous resistance level, and
Support: I think it makes a lot of sense that Bitcoin pulls back to previous resistance around the $12,000 level, dipping possibly as low as the $11,000s. That would make for a clean test of new support/former resistance and a healthy reset before resuming the uptrend to higher highs in Q4. Areas of note are $12,000, the 50 Day EMA around $11,800, $11,000, and $10,000 which is major psychological support and around the 200 Day EMA.
Resistance: I think Bitcoin is carving out a new range in which case $14,000 is the new point of resistance. I think we'll see some very choppy price action over the next few weeks, so look for swings in both directions, though my very short-term bias is to the downside for an Election/COVID-induced pullback before the buyers step in and we test $14,000 again. After that, I don't think $15,000 is a major resistance level, so anything above that I think is a slingshot to $20,000.
About Us:
If you enjoy these posts, please support the channel by "Tipping" this post below, or using either of the referral links below.
They cost you nothing and give me a small reward, which makes me a little happier to share these personal analyses with you at no cost.






