So the bulls are back in town! This is especially so for Ethereum after the cryptocurrency witnessed a 7.8% price increase over the past 24 hours of trading to climb back above the $200 level for the first time since September 2019.
In fact, Ethereum has now witnessed a 64% price increase since the new decade started!

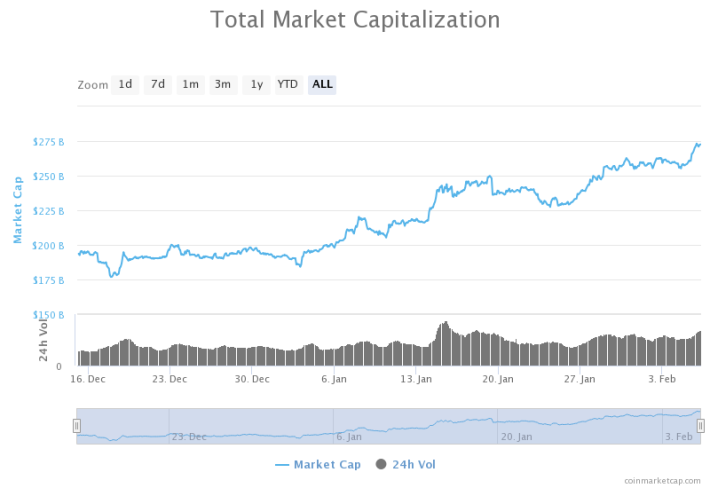
Over the past month, the total market cap for the entire industry has risen from a low of $185 billion to reach a high of around $272 billion.
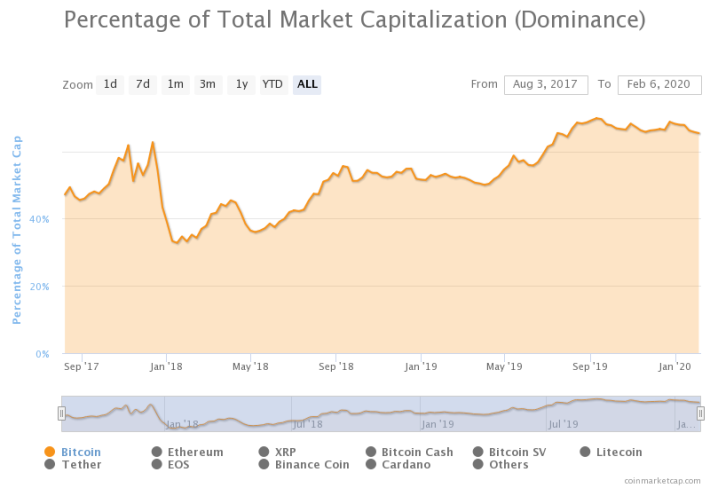
The interesting thing about this bull run is that, even though Bitcoin is increasing, the altcoins are increasing at a higher pace than Bitcoin itself. This is leading to the BTC Dominance to start to fall as it slips beneath the 65% market dominance level;
Where Is The Next Stop?
This price increase is largely driven by the fact that Ethereum has also been making fresh highs against Bitcoin itself. In January, ETH has climbed a total of 24% against BTC. Considering that Bitcoin has only increased by 40% you can see why Ethereum has surged by a total of 60%+
So the real question is, where is the next stop? Well, this all depends on how Bitcoin plays out and if Ethereum can continue to climb further against Bitcoin above 0.021 BTC over the following weeks.
Let’s take a look at the market and analyze the market to highlight some potential areas of support and resistance moving forward.
Ethereum Price Analysis
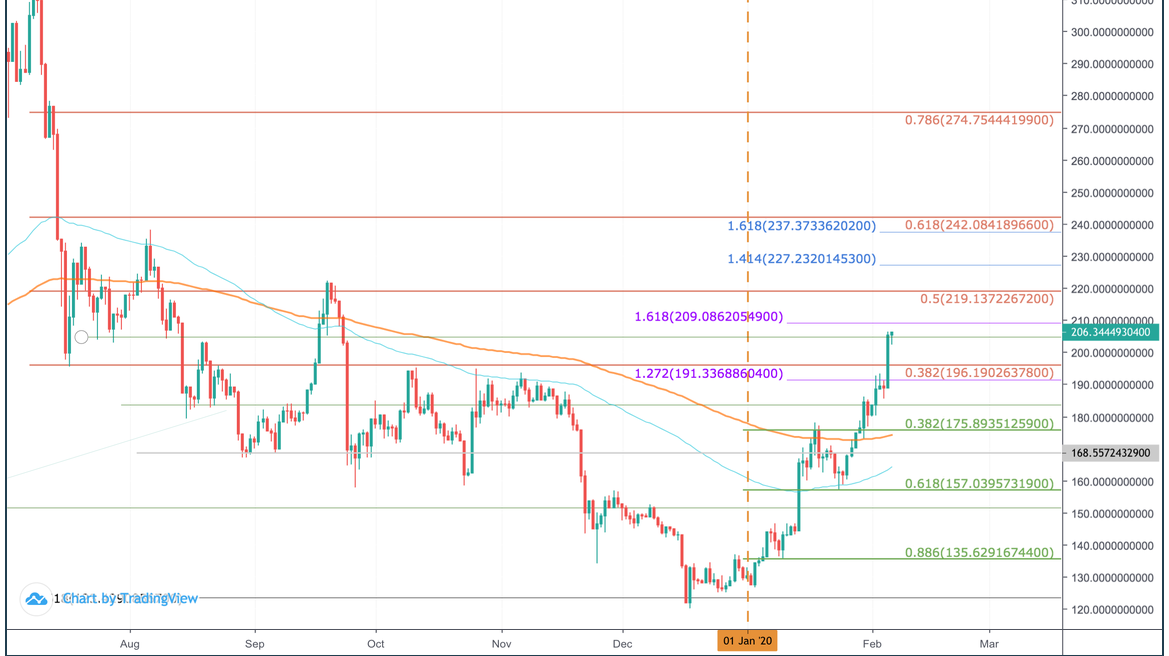
ETH/USD - MEDIUM TERM - DAILY CHART
What Has Been Going On?
Taking a look at the daily chart above, we can see that Ethereum started to surge as soon as 2020 opened for trading. It began by bouncing from the $130 level as it started to make its way toward the 200-days EMA by mid-January 2020. Ethereum did struggle at this level for a few days, however, it managed to find strong support at the 100-days EMA at around $160 which allowed it to rebound once again.
After the rebound, Ethereum surged above the 200-days EMA during the closing days of January. It managed to break as high as $185 as January closed and continued to climb further higher as February began trading.
During February, the cryptocurrency continued to rise further higher. It found slight resistance at a short term 1.272 Fibonacci Extension level at around $191. The resistance between $191 and $194 was considerably strong due as it had also provided resistance for the market during October and November 2019. Nevertheless, Ethereum penetrated above this level and, in the same move, it broke above additional resistance at $196 that is provided by a long term bearish .382 Fibonacci Retracement level.
Ethereum then went on to climb above $200 to reach the current trading level at around $205.
Where Can We Go From Here?
We are most certainly bullish at this moment in time, especially considering the fact that Ethereum created a fresh 5-month high today. The market will remain bullish so long as Ethereum can remain above $175. If it drops beneath this level then Ethereum would be considered as neutral with a further drop beneath $160 turning it bearish again.
If the bulls continue to drive Ethereum higher, the first level of resistance is expected at the $209 level which is provided by a 1.618 Fibonacci Extension level. If it continues above $210, the next stop is located at $219 which is provided by the long term bearish .5 Fibonacci Retracement level. This Fibonacci Retracement is measured from the July 2019 high to the December 2019 low.
If the buyers continue to drive Ethereum above the resistance at $220, additional resistance lies at $227 (1.414 Fib Extension), $237 (1.618 Fib Extension), and $242 (bearish .618 Fibonacci Retracement level).
What If We Pull Back From Here?
On the other hand, if the sellers push Ethereum for a small pullback, the first level of support is, of course, expected at $200. Beneath this additional support lies at $196, $191, $185, $175 (short term .382 Fib Retracement & 200-days EMA), and $160.
Let us take a quick look at Ethereum against Bitcoin and highlight some potential areas of support and resistance on this market.
ETH/BTC - MEDIUM TERM - DAILY CHART
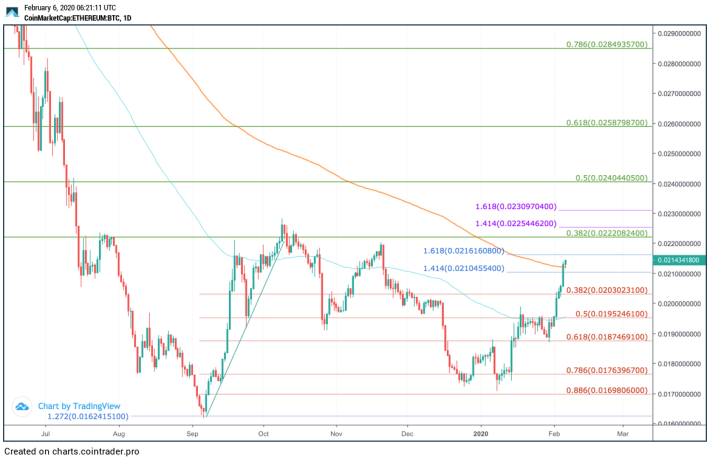
What Has Been Going On?
Taking a look at the long term view of ETH/BTC we can see that 2019 was not kind to the cryptocurrency. However, it did manage to rebound at the 0.0162 BTC level during September to reach a high slightly above 0.022 BTC. Unfortunately, it continued by grinding lower from this high and dropped into the 0.0173 BTC region to close 2019.
During 2020, we can see that, except for the brief spike toward 0.017 BTC, Ethereum has been on a tear against Bitcoin. The cryptocurrency reached resistance at the 100-days EMA at around 0.0195 BTC during mid-January and was unable to overcome this level for the rest of the month.
As February started to trade, we can see that ETH penetrated above the aforementioned resistance and started to climb further higher. It took out resistance from the December 2019 highs as it penetrated above 0.02 BTC and continued to climb further higher to reach the current trading level at 0.0214 BTC. It is currently supported by the 200-days EMA at 0.021 BTC making it the first time it has broken above this level since July 2018.
Where Can We Go From Here?
If the bulls continue to drive ETH/BTC higher, the first level of expected resistance lies at 0.0216 BTC (1.618 Fib Extension). Above this, higher resistance lies at 0.0222 BTC which is provided by the long term bearish .382 Fibonacci Retracement level - measured from the June 2019 high to the September 2019 lows.
Above 0.0222 BTC, resistance lies at 0.023 BTC (1.618 Fib Extension) and 0.024 BTC (bearish .5 Fib Retracement).