
Bitcoin bounced by around 4% over the past 24 hours after it rebounded from support at $9,600 and climbed back above $10,000 to reach $10,100. The cryptocurrency had found some resistance when it ran into the $10,400 region causing it to roll over and retrace for a few days.
The latest retracement brought the 7-day price movement down to -1.85% for Bitcoin, however, the cryptocurrency still remains up by 11% over the past 30-days of trading. Also, let us not forget the fact that Bitcoin has actually increased by a total of 46% from the 2020 price low so the strong underlying bullish momentum is still intact!

In the midst of the latest price retracement, there was a VERY STRONG bullish signal that has started to get many analysts rather excited. Myself included.
The bullish signal that I am talking about is known as a “Golden Cross” signal.
What The Hell Is A Golden Cross?
The Golden Crossover signal is a very strong bullish signal that occurs when the 50-day SMA (moving average) crosses up above the 200-day SMA. It can be any particular SMA, however, these are very commonly used and are often considered as the standard for the Golden Cross.
In fact, if we use a different type of moving average, known as an exponential moving average (EMA), the signal came in early February 2020. However, the recent Golden Cross on the SMA has confirmed the signal.
The reason that it gets analysts extremely excited is the fact that, historically, it has caused a surge each time this signal appears - regardless of what market we are in.
It signals a strong shift in sentiment and typically sets up a longer termed bullish trend and therefore analysts are predicting Bitcoin will continue to climb over the following weeks - likely at a more aggressive pace than we are seeing now.
To make things easier to understand, let me show what the latest Bitcoin Golden Cross looks like;
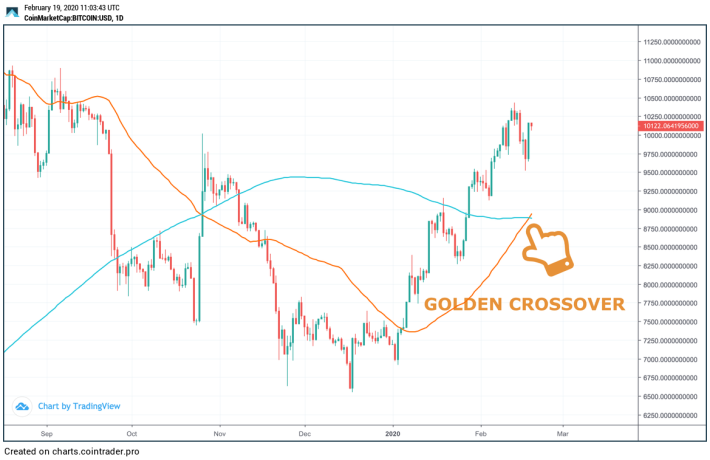
You can clearly see it in the chart above. The hand is pointing to the moment that the Golden Crossover occurred as the orange 50 day SMA crossed up and over the blue 200 day SMA.
It is indeed important to wait for the moving averages to diverge away from each other to confirm that this is not a “false signal” but typically, it rarely is a false signal.
So, What Happened With The Last Golden Cross?
The last cross was in April last year. After the Golden Cross occurred, depending on how and where you measure it from, Bitcoin went on to surge by a total of around 165%. Some analysts have measured higher returns but this is relative to where you think the cross actually occurred. Regardless of this, you can see the bullish push higher after the Golden Cross signal.
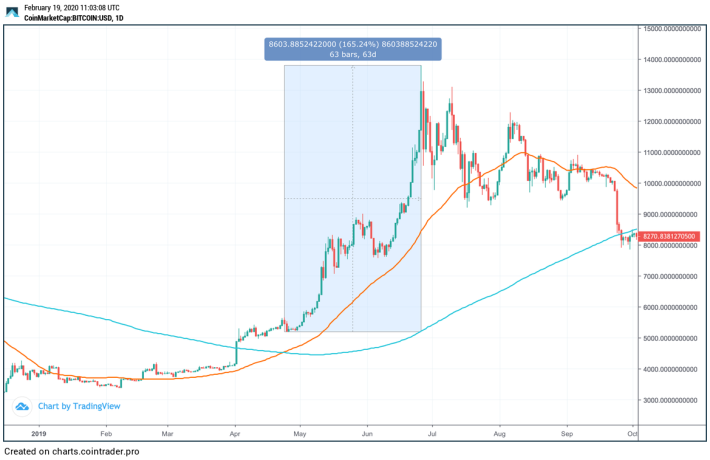
After the Golden Cross appeared, it took the market around 5 days before it started to kick into gear and climb higher. But the bullish momentum went on for another 60 days after the signal was generated, indicating the long term trend shift.
The interesting thing about this current crossover is that, if the length of the bullish push is similar to the 2018 Golden Cross above, we can expect the bullish momentum to continue to drive Bitcoin higher right until the Bitcoin Halving that is expected to occur in around 78 days from now.
So, where can we go from here? Well, let’s take a look at the charts and highlight some areas of support and resistance moving forward.
Bitcoin Price Analysis
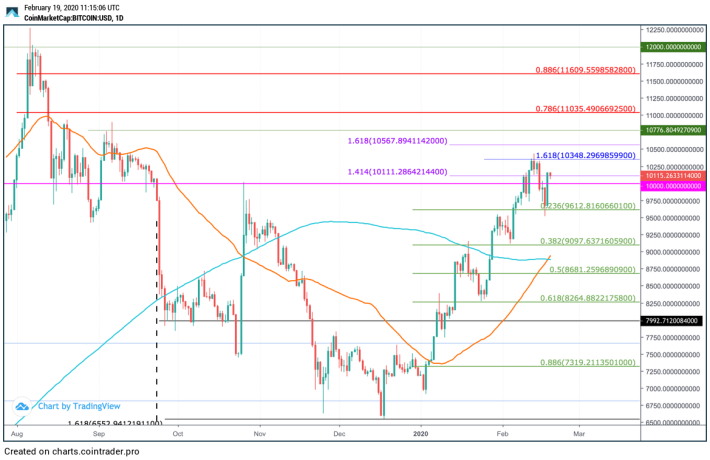
BTC/USD - MEDIUM TERM - DAILY CHART
What Has Been Going On?
Taking a look at the daily chart above, we can see the majestic price increase that Bitcoin has seen so far throughout 2020. The cryptocurrency started at a low beneath $7,000 and began its ascension higher.
It initially ran into resistance at the 200-days SMA during mid-January at around $9,000 and went on to fall in to support at around $8,260. The cryptocurrency went on to rebound from here and turbocharged itself past the 200-days SMA toward the end of the month.
When February came around, Bitcoin continued to climb even higher. It eventually went on to reach the resistance at a short term 1.618 Fibonacci Extension level priced at $10,348 during mid-February. It spent a few days trying to overcome this resistance, however, after a 3 or 4 attempts, it eventually rolled over and started to fall as it dropped back beneath $10,000.
Bitcoin then went on to find support at the short term .236 Fibonacci Retracement level at $9,612 which allowed the cryptocurrency to bounce higher to break back above $10,000 and reach the current trading level at $10,100.
So, We Are Still Bullish, Right?
Yes, we are still strongly bullish. Bitcoin would need to actually drop beneath the support at the 200-days SMA at around $9,000 before the bull run is in danger of becoming invalidated.
If the sellers do push lower again, we can expect the first level of support to be located at $10,000. Beneath this, additional support lies at $9,612 (.236 Fib Retracement), $9,500, and $9,250. The support at $9,000 is considered to be pretty strong due to the simple fact that the 200-days SMA is located slightly below this area. It also further bolstered by the short term .382 Fibonacci Retracement level which is priced at $9,097.
If the bears continue to push Bitcoin beneath $9,000, we can expect additional support at $8,681 (.5 Fib Retracement), $8,500, $8,264 (.618 Fib Retracement), and $8,000. Although, it is not expected for Bitcoin to drop anywhere near these levels.
What If We Don’t Even Pull Back?
If the bulls continue to drive higher above $10,100, the first level of strong resistance lies at $10,348 (1.618 Fib Extension). This is where Bitcoin struggled during mid-February and the market will need strong momentum to overcome this level. It is lucky that the momentum is within the bullish favor because this means that we should be able to break this resistance on the next push higher.
Above this, resistance can be found at $10,500, $10,567 (medium termed 1.618 Fib Extension), $10,776, and $11,000. The resistance at $11,000 is further bolstered by the long term bearish .786 Fibonacci Retracement level).
If the bullish pressure continues above $11,000, higher resistance is located at $11,102, $11,200, $11,400, and $11,609 (bearish .886 Fibonacci Retracement level). This is then followed with more resistance at $12,000.
Conclusion
In conclusion, it seems that we have indeed received confirmation that the bullish run should be extended all the way up until the Bitcoin halving with the latest Golden Cross signal. It is important to note that this does not result in an instant push higher but is more so a gradual shift in momentum which allows for the buyers to continue to slowly grind upward. The Golden Cross just shows that there is now a long term shift in the trend and we are most certainly bullish at this moment in time. You still need to manage your entries wisely and should not just blindly enter any trade just based on this signal.
Happy trading out there! Cover yourselves and stay disciplined!


