At the time of writing, BTC's price fluctuates at $8,200 on Bitstamp and trading volumes are low on the cards.
What do the charts tell us?
Bitcoin 4 hour chart
Bitcoin is starting a downward trend, a nice consolidation after the last increase. I see this as a healthy sign for bitcoin after the rise in 2019.
The fact that BTC remains calm means that the dominance of the largest crypto currency is decreasing somewhat: 66% at the time of writing.
We can see that the smaller crypto coins are getting some air and that they show some slight growth.
On the 4 hour chart we see that bitcoin has found support for the time being and has made a higher ground (figure 1 below, ed.).
It looks like Bitcoin wants to go up, but for this to happen we need to break through $8,500.
Until then, we will still be on the bearish side of the market. In orange are the possible targets as soon as an outbreak starts upwards.
We also park the $10,190 level for a while, because we judge this as a so-called future gap that can be filled sooner or later.
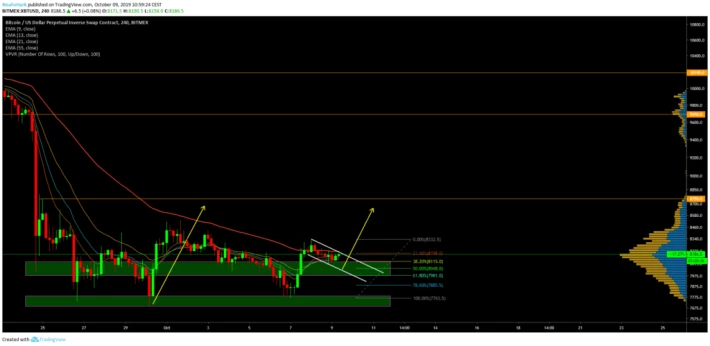
Figure 1: bitcoin (BTC) 4 hour graph (BitMEX)
Bitcoin daily chart
Why I'm still bearish is because bitcoin on the day chart remains below the 200 moving average (figure 2 below, ed.). This 200MA has proven to be a very important level in the history of Bitcoin.
It has to break first, before we go back to $8,800 and possibly $9,700.
If this rise has been, I expect a correction to the golden pocket around $6,900, which I discussed in my previous analysis.
The price could then shoot down slightly, but not much further than $6,500.
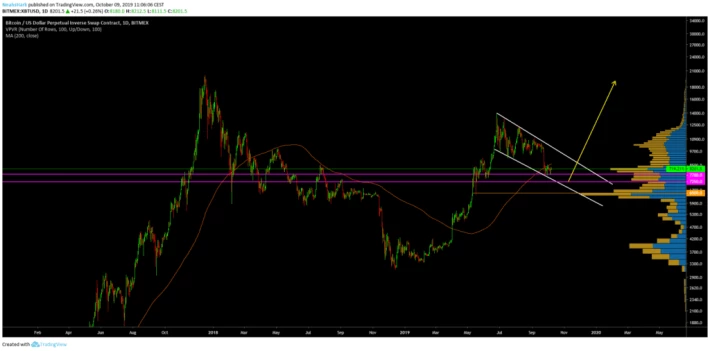
Figure 2: bitcoin (BTC) day graph (BitMEX)
Bitcoin weekly chart
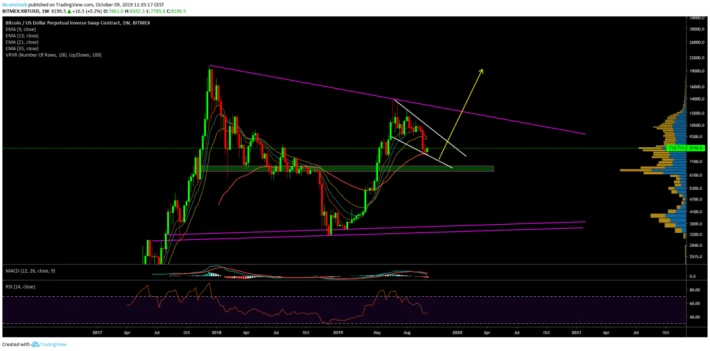
Bitcoin dips are bought quickly, which can be seen on the weekly chart of bitcoin below (figure 3 below, red.) . There is a lot of support and on a larger timeframe we are in a bullflag.
The chart looks positive and the expectation is still rising and we don't see a "bear market" happening yet.
As long as the bitcoin dominance (approx. 66%) continues to decrease, it is also nice to take a look at altcoins, because there is certainly something to trade here. But this is absolutely no financial advice. Trading in cryptic currency is very risky.