
On the chart of Bitcoin you can see a triple bottom pattern. As a result the price has risen well, but it also finds several resistance points.
Bullish news is needed as a catalyst to get the price over that. Will the Bitwise ETF take care of that?
Bitcoin weekly chart
On the weekly chart the price shows a nice green candlestick and keeps the 100WMA (see figure 1). This is important and bullish. On the lower timeframes a triple bottom pattern can be clearly seen as well.
If the price on the 100WMA has found the bottom, then it still takes a lot to convince me that this is really bullish.
There are still many resistances to overcome, including the 26, 21 and 12 EMAs. Also the resistance of the descending triangle needs to be broken.
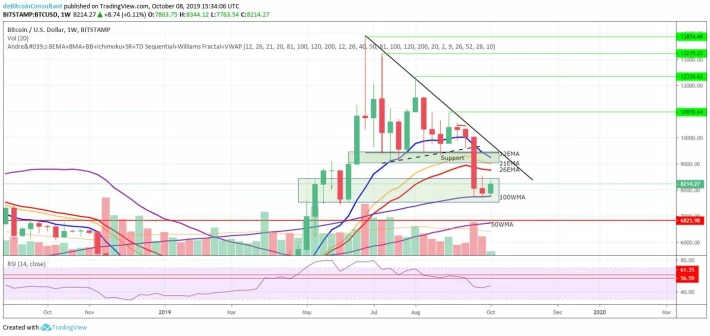
Figure 1: The price keeps the 100WMA and finds resistance points at 26/21/12EMA's.
Anything under $10,000 is also lower high and there's nothing exciting about it. A signal that bears are exhausted and the bulls are stronger, is a bounce towards the 26EMA/21EMA between $8,750 and $9,000.
Just don't forget that the price is still below the 200DMA (~$8.600).
If the price remains below the 200DMA (figure 2 below) and is rejected there again, there is a good chance that the 50WMA will be searched for around $6,800.
Bitcoin daily chart
The daily chart (Figure 2, below) shows that there is potentially a triple bottom pattern. This may indicate a reversal of the price.
For this purpose the bulls have to break the 12EMA and come out of the descending triangle which is formed by the black resistance line and the 100WMA.
Next to that also the 200DMA/$8,600 will be an enormous resistance which has to be broken. The price has been below the 200DMA for almost two weeks now. Despite the bullish action of the triple bottom and the rising RSI on the three bottom points, this does worry me.
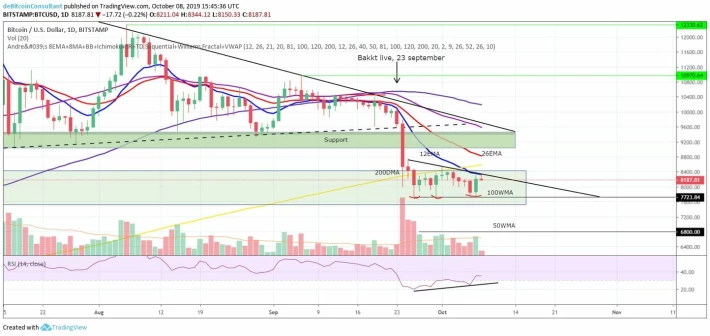
Figure 2: The price makes a triple bottom and finds resistance on the 12EMA/$8,350.
Yesterday's volume was good, but today's share price comes to a standstill on the 12EMA. The bulls will have to prove themselves in the coming hours.
Bitcoin 4 hours chart
On the 4-hour chart (figure 3, below) you can see that the price is producing lower highs. The bulls have gotten the price above 12 and 26EMA, which is bullish. However, they haven't been able to produce a higher high.
A lower high (LH) has been made. The price still holds the 12/26EMA's. As long as they keep this and thereby make a higher low, there's a big chance that the resistance will be broken. Bullish news in the form of an approval of a Bitwise ETF would be welcome help for the bulls.
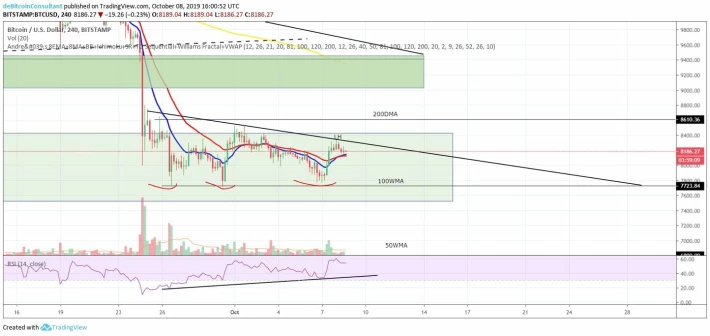
Figure 3: The price has landed bullish above 12/26EMA, but will also find resistance there immediately and will make a lower high.
Conclusion
On the weekly chart the price still looks okay and it is good that the 100WMA is held. A point of concern is that the price has been below the 200DMA for almost two weeks now. The longer it is there, the worse it is for the price.
Despite a number of bullish signals in the charts (such as the triple bottom pattern and a rising RSI), it won't be easy to break through the 200DMA.
The 4-hour chart still looks bullish for now because the bulls keep the 12/26EMA. A bullish novelty for the bulls would at least help them a lot.






