
The Bitcoin price caught a bit of relief on June 4 to reach a daily high of $9,881. However, the price failed to flip the $9,840 level as support and has already begun to show weakness.
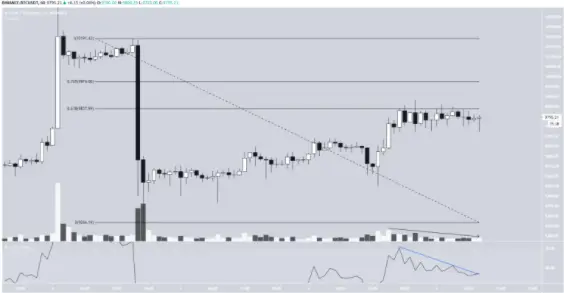
At the time of writing, the BTC price was trading right at the 0.618 Fibonacci level of the entire downward move that began on June 2. While it has moved above this area in the form of an upper-wick, it has failed to reach a decisive breakout.
Bitcoin Short-Term Trend
Volume has been minimal, indicative that a decisive move in either direction will soon occur. If a breakout occurs, the next resistance level would be found at $9,980, the 0.786 Fib level of this downward move.
The hourly RSI has begun to generate some bearish divergence, a sign that the price will not likely break out above this level, rather it will get rejected and move downwards.
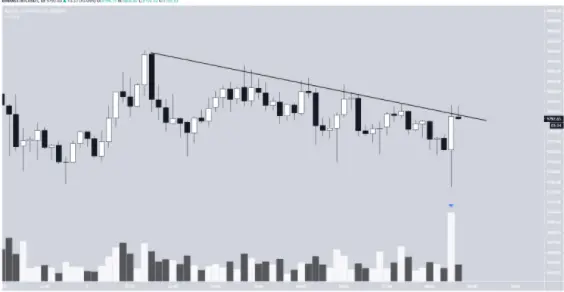
However, in the short-term, BTC just created a bullish candlestick with very high volume and is again directly under the descending resistance line attempting to break out. This could cause another attempt at moving above $9,840, but due to the aforementioned bearish divergence and resistance, it’s expected to fail.
Future Movement
In the longer-term, we can see that BTC has been following a very steep ascending support line since the bottom on March 13. However, the price is also facing strong resistance at $10,400, an area above which the price has not traded since September 2019.
Bitcoin reached this area on June 1, but decreased and created a bearish engulfing candlestick the next day.
The ascending support line and $10,400 resistance area will coincide with each other around June 16. Therefore, a decisive move is expected to occur sometime before this date.
Due to the bearish divergence that’s also present in the daily RSI and the decreasing volume throughout this upward move, a breakdown is more likely. If one occurs, it is likely to be rapid, due to the lack of support below the current price, especially if $8,000 is broken.

What do you think we will see in the coming week / month? Do you agree with the above analysis? Also If you like this content, consider tipping the article / following me, so more people see this content and we get a nice discussion going on.
Also, If you are interested in trading, I would suggest you try out BeInCrypto's free Telegram chat. I am there and it is growing very quickly (over 3,000 members) where they discuss the market and share interesting content. They also have a free premium channel where they have a cryptocurrency trading course and daily trading signals. If you are interested, you can click here.
Until next time, stay classy crypto world!






