
The Bitcoin price began the week of June 1 with a considerable increase, reaching a high of $10,380.
However, the price dropped sharply afterward, creating a long upper-wick and possibly a reversal candlestick.
Bitcoin Weekly Close
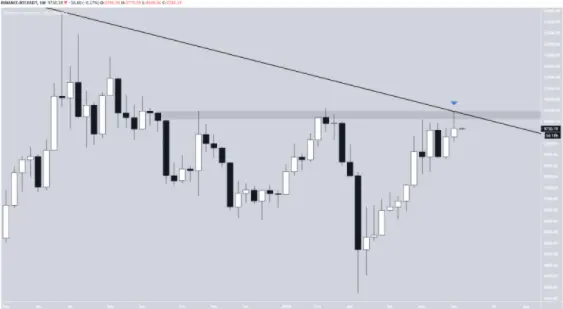
The Bitcoin price has been following a descending resistance line since the all-time high price reached in December 2017. At the time of writing, the resistance line coincides with the $10,400 resistance area.
Last week, the price reached this area, only to get swiftly rejected and create a long upper-wick with a small body, amounting to a shooting star candlestick. Even though the close was bullish, this can still be read as a possible reversal candlestick, since it’s occurring after an upward move and inside a confluence of resistance levels.
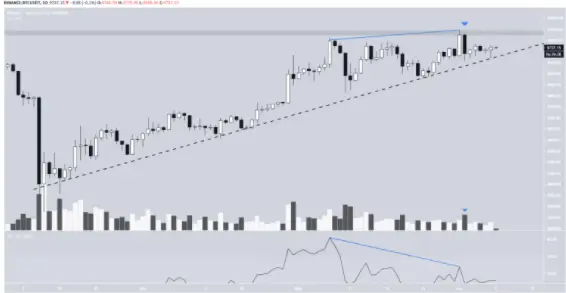
The daily chart also provides a bearish outlook. Once the price reached the $10,400 resistance area on June 1, it decreased rapidly the next day, creating a bearish engulfing candlestick with high volume.
In addition, the daily RSI has generated considerable bearish divergence, another sign that the price is likely to decrease and possibly break down from the long-term ascending support line in place since March 13.
The support line will coincide with the $10,400 resistance area by June 20 at the latest, so a decisive move is likely to occur by then.
Short-Term Movement
Despite the long-term bearishness discussed in the section above, the short-term chart looks bullish. The price has broken out from a descending resistance line and is trading above both the 50 and 200-hour moving averages (MA), which are very close to making a bullish cross.
In addition, the price is possibly trading inside a parallel ascending channel. Therefore, it is likely to increase to around $9,970, the 0.765 Fibonacci level of the previous decrease and the resistance line of this channel.
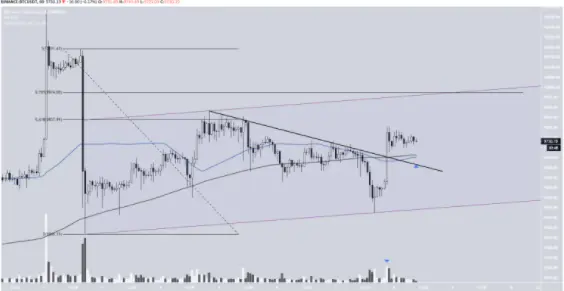
To conclude, the short-term outlook for BTC is bullish, suggesting that an upward move to $9,970 is possible. However, the long-term outlook is bearish, indicating that a breakdown from the long-term ascending support line is likely to occur.
What do you think we will see in the coming week / month? Do you agree with the above analysis? Also If you like this content, consider tipping the article / following me, so more people see this content and we get a nice discussion going on.
Also, If you are interested in trading, I would suggest you try out BeInCrypto's free Telegram chat. I am there and it is growing very quickly (over 3,000 members) where they discuss the market and share interesting content. They also have a free premium channel where they have a cryptocurrency trading course and daily trading signals. If you are interested, you can click here.
Until next time, stay classy crypto world!






