
Therefore, the Bitcoin course Bullrun may not be far away
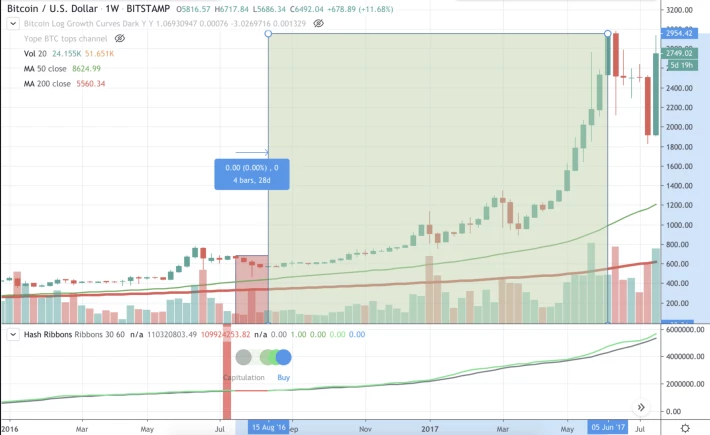
The Hash Ribbons indicator combines the hash rate of Bitcoin with the current Bitcoin price and the resulting difficulty. Each time a Miner capitulation is imminent due to a sharply falling Bitcoin price, the indicator switches to red. This means that many miners on the market can no longer operate mining profitably. As a result, they temporarily switch off their mining hardware until the Difficulty adjusts and the mining becomes profitable again. Due to these fundamental factors of Bitcoin this indicator generates a clear buy signal.
In the past this indicator has proven to be very reliable. For example, it has announced the upward trend from mid-August 2016 to early June 2017, after the indicator left the red zone after 28 days and generated a clear buy signal shortly thereafter.
At the end of 2018, he predicted a reversal of the trend for the Bitcoin price, which peaked in mid-2019 at an interim high of almost $14,000. At that time, it took 70 days to break out of the red zone and generate a buy signal shortly thereafter.

The short-term countermovement this year was also predicted by the Hash Ribbons indicator shortly before the turn of the year.

Currently we are back in the red zone for 21 days.

Those who have taken a closer look at the chart above will probably have noticed that the Hash Ribbons indicator always follows a similar pattern. It begins with a sharp drop in the Bitcoin price, followed by a consolidation phase. This consolidation phase usually ends a few weeks after the indicator has generated a buy signal and triggered a new bull run.
This means that the consolidation phase between the buy signal and the bull run is in theory the perfect time to buy Bitcoin and bet on a rising Bitcoin price. More risk-averse traders can even start acquiring BTCs after the sharp drop in the initial phase, for example by using the Dollar Cost Average method on a weekly basis.






