
Hello friends once again here.
Let's take a quick look at the Bitcoin situation.
As we have seen, after three days of boring price action within a range of $6,500 - $6,800, Bitcoin saw a big drop back to the area of almost $6,000, over 10% was lost in a matter of hours.
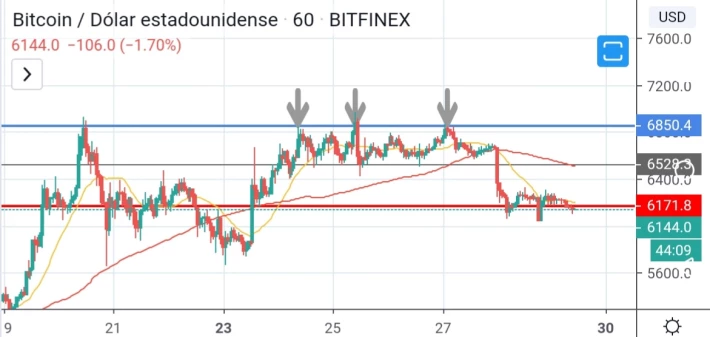
Looking at the hourly chart, we see how the evolution has been in the last few hours, we were in a lateral movement and in the end it has not been able to overcome the resistance of $6850, falling so to the support we draw.
Can it go lower than that area?
It seems that the panic has passed, it is simply lack of confidence and the lack of confidence is not so bearish, right?
Let's change the method and see if it will hold on this support or will look for the lower support.
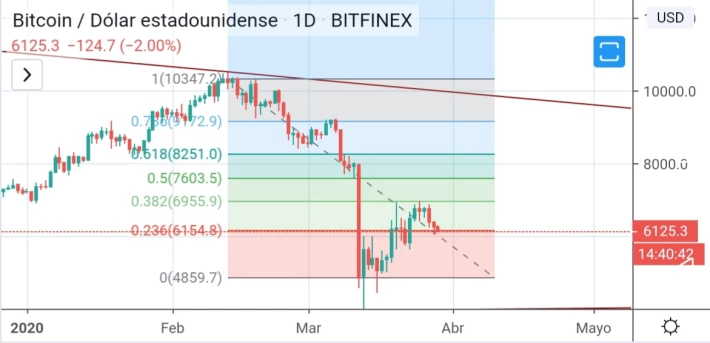
Looking now at the descending and melee drawn Fibonacci retracements,( just to give an idea of how or where we are 😁)
Actually, looking at this retracement, make us a little disappointed, we haven't gotten there to the $8200 area, at least the 50% retracement, which is at $7,600, that's what we were looking for, was this a flop on Fibonacci ?
The truth, if we draw it in an ascending way, we will see that its levels are correct, almost perfect, and they coincide with Elliott waves.
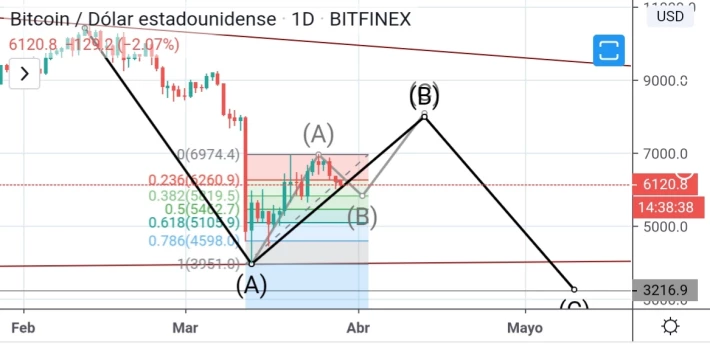
That leads to the Bitcoin price will go down a bit more before it goes up, almost to $5800 or $5400 or also up to $5100
That's all for today, thank you, greetings to all.






