For Educational Purposes only.
Keep technical Analysis simple.
Conortrades
Twitter : My precious xrp
@ccryptosecure
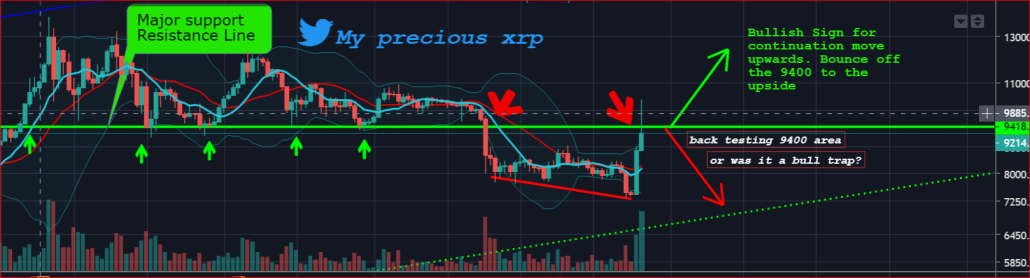
Bullish sign for BTC.
Introduction
I am doing a Technical analysis of BTC from both a Bullish stand point and a Bearish stand point. Bullish is simple to predict its going up :)
TA is about getting a high probability of finding the trend in the direction you expect it to go in via data gather and patterns seen or using indicators or ocilliators the more tools you have in your tool box the better the TA you can make. But the real secret is to keep it simple.
Divergence has been seen on a few indicators (Macd, Rsi) which is a very bullish sign that a big move was incoming and it was 3000 dollars in 1 day. But is it going to continue or is the major resistance going to reject the bulls? As you can see from the Large wick there is a lot of pressure from the bears now pushing btc back down below the major resistance. But will the bears hold their ground or will the bulls take over power again? 9400 Line is very important and if price action stays above it going into November, then the bulls will be in control. But if not, the bears will be back in control.
I have two plays that I am watching and I will decide when I take a magnified look at my TA again sometime in the coming days.
1st Play is the retest the 9400 usd point before further downside. If the price goes up and the body of the candle stays Below the line then it’s a bearish sign.
2nd Play if 9400 is passed and then the body comes back down to bounce off the 9400 area to the upside then I will be bullish on BTC. This is a Key Support/resistance line.
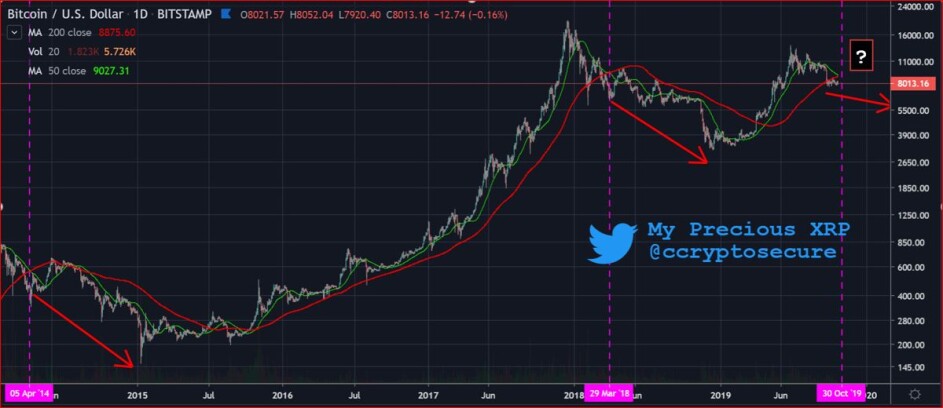
Bearish Signal for BTC. Death Cross
Purple Zone are Death crosses. Is it a true death cross or a fake out?
Blue dotted lines are November dumps from the last 5 years
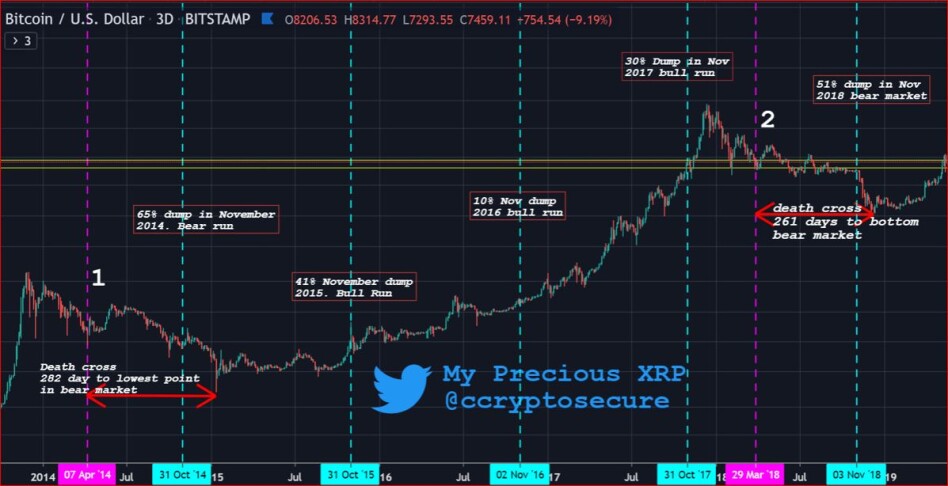
Taking all the Data from the previous years I can now make a calculated observation with above the odds probability that the following will play out in coming months.
I am thinking there is going to be a slight recovery to the 200ma in coming weeks back testing it for confirmation around the 9200 or 9600 pricew area.
 Conclusion.
The death cross has happened and BTC took a dis-liking to it 😊 and surged over 3000 dollars in 3 days over a weekend. Retail trading, I don’t think so. More at play than you think. My radar is up. Manipulation you say, may be. These moves are not retail ( you and me) moves that is for sure.
So we are up at a major support and resistance level and I think we will stay around it until Tuesday 29.10.19 and then whatever side it is on, by that weekend is, where the trend is going to continue in my eyes.
My big question: Is the Death cross a fake out or was the Bull run a fake out before the Big dump to lower levels for BTC and allow the Alt-coins some breathing room?
Its quite simple folks above 9400 by next weekend is bullish for BTC
Below 9400 by next weekend is bearish.
This is only the Beginning of my Analysis guys. What about Alt-season, is it not going to get a go at all or is it all going to be BTC's cake to eat?
Well here is my take on the number 3 Alt-coin XRP.
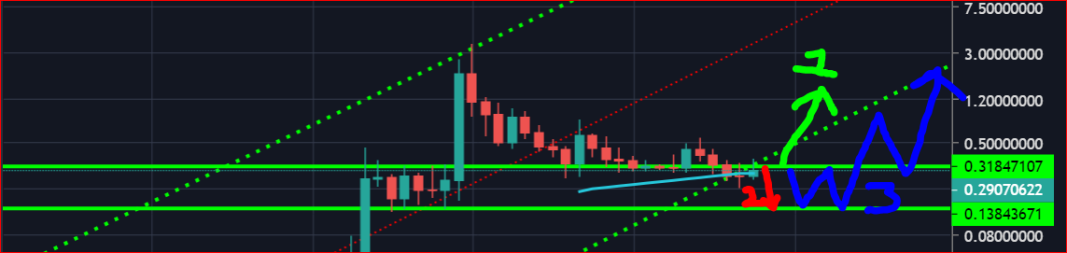
Bullish sign XRP. For Educational purposes only.
Finished Elliott wave with ABC correction
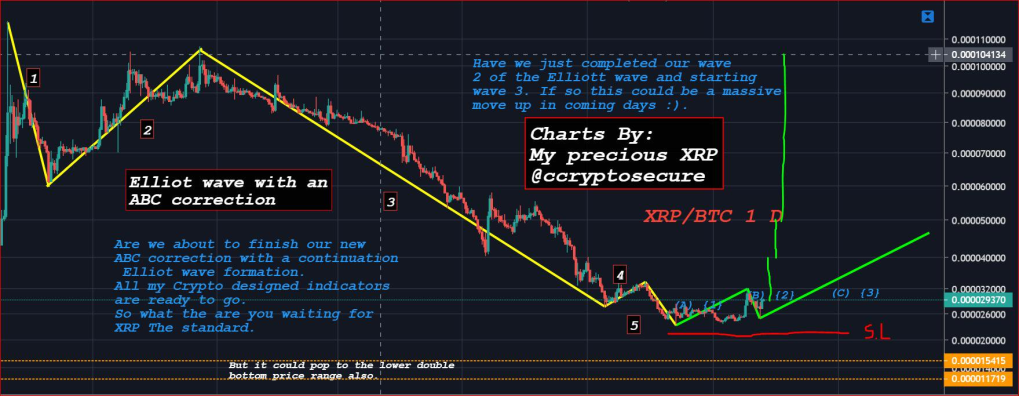
One year out look of XRP if the volume of previous bull run market comes back.
188 dollars by September 2020
31 Dollar on January 2020
5 Dollars by Christmas day. Happy Christmas everyone
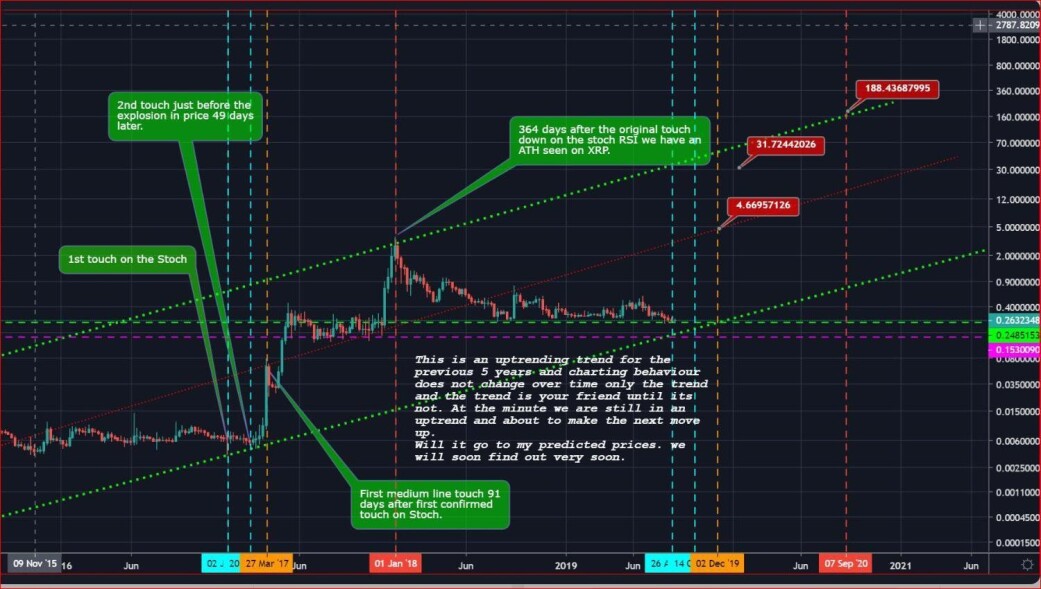
We are in heavy over bought territory and if there is no volume coming into the market next few weeks I suspect probable that the Signal will turn Bearish very quickly.
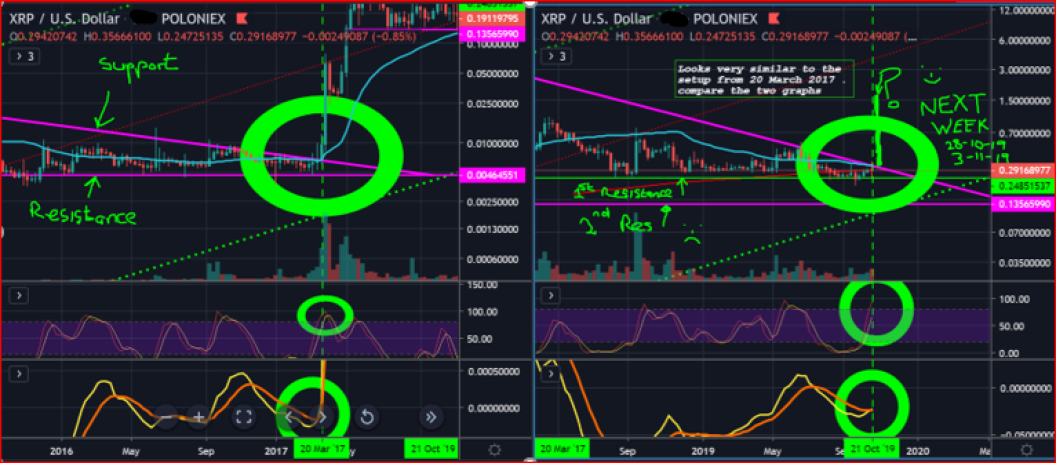
Chart showing similar chart performance close to the support line.
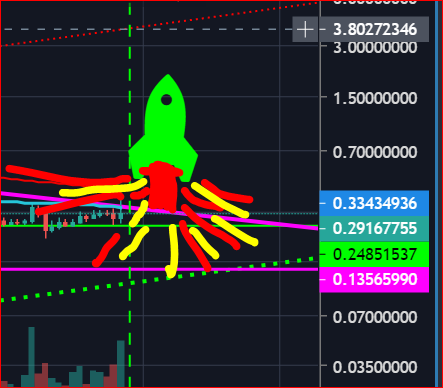
There is a lot of information in these charts that can not be taught here, but can be learned from a basic course or reading up on indicators. If the volume continues to come into the market like it has, then we have a high probability of taking off in our rocket ship see next slides.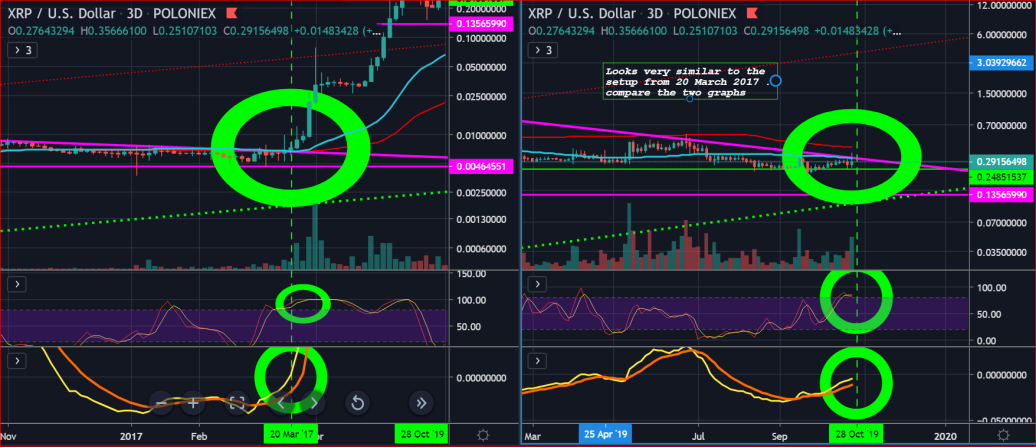
Maybe a Decoupling of BTC is on the cards? who knows :)
But its not all good news.
Because we are over bought in some time frames and the clear market manipulation that is clearly going on, then the bearish play could be on the table for XRP to 13 cents usd. It’s a possibility folks.
Until regulation and proper governance of the institutions by regulator’s they are free to basically do what they want. So if this happens guys just be prepared to exit if level 4 does not hold.
For educational purposes only if you know what I mean.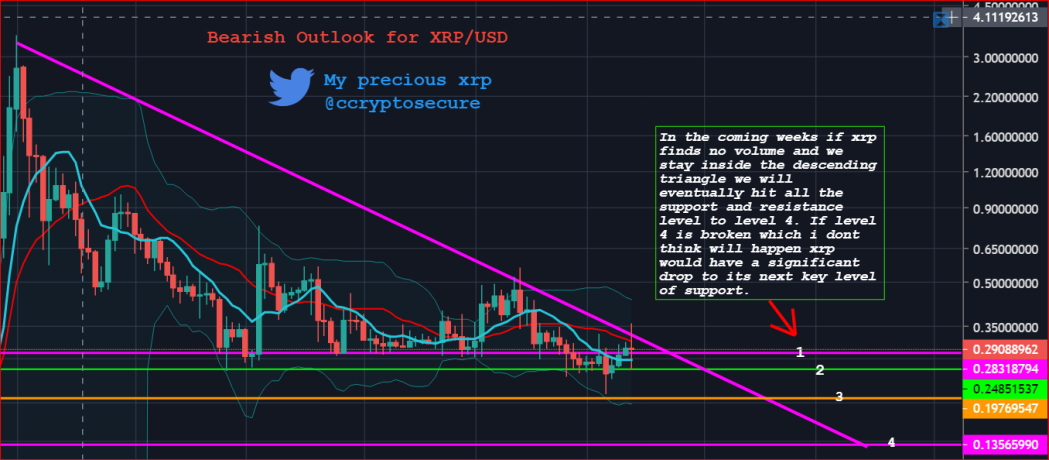
Conclusion
XRP is very close now to making its decision on what it is going to do. Rocket or dump or the third option is to go sideways. We are inside a descending triangle and its go time folks. It has to either break out of triangle or fall to lower levels. Charts look similar as to 2017 chart but if the volume does not come its going to drop hard in my experience. 3 day and weekly indicators still have upside potential but with out volume this upside potential will soon become downward action very quickly. Or the third option is to continue going side ways from (13 - 24) cent to (30 - 32) cents for coming weeks.
Swell 7-8 November.