
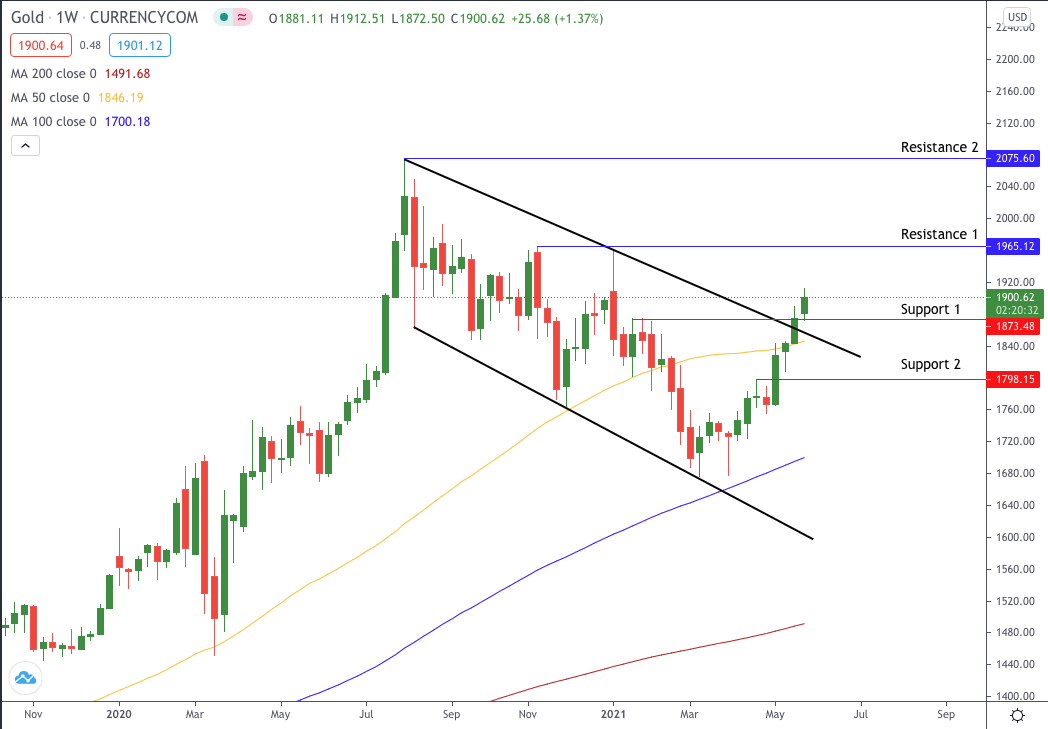
As we can observe on the Gold Spot Weekly chart the commodity has been moving in a channel from the start of August 2020. The return line of the channel has been tested 5 times so far confirming it, along with the trend line which was tested 2 times before it was broken to the upside.
Currently the price is at the $1900.62 price level. This is the second period that the price has been trading outside the channel thus confirming the 2 period rule for the timeframe.
We expect the price to move higher to the first resistance level of $1965.12 (Resistance 1) which consists of 2 resistance levels, one from the 9th of November 2020 and one from the 4th of January 2021. Further movement above the resistance level could indicate a further movement to the $2000 phycological price level.
If we observe a break below the support level at the $1873.48 price level (Support 1), we expect the price to move lower retesting the channel trend line. A further break below the channel trend line and the 50 period Moving Average (Yellow) would indicate a fake break of the channel and we can see the price moving lower to the support level at $1798.15 (Support 2).
*Not Investment Advice. Please note that this is our opinion and nothing is guaranteed. Do not trade by taking into consideration our analysis but study by yourself.


