

Hello! I present my idea on a daily chart for the price of ETH.
Accompanying the price of the giant in capitalization BTC, the cryptocurrency Ethereum follows a similar pattern.
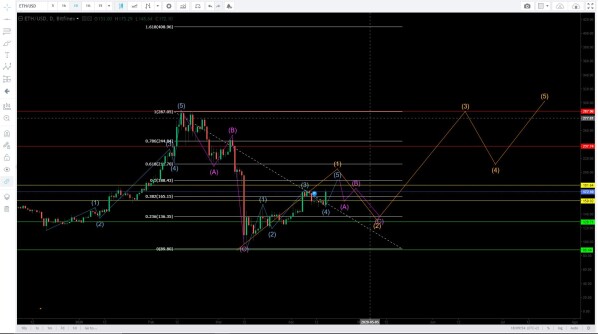
Trying to find the right waves in the movement, I think I see the price below 140usd again, but not before going up a bit to around 180 / 190usd.
A truncated or incomplete 5 (C) wave may occur and the correction is already beginning.
There are many ways to interpret the waves and I am not fully convinced of this graph so be careful right now, although we will see a strong and solid ETH again right now I think it is not the time.
Right now what I am clear about are my buying or selling areas for short or long operations, the horizontal yellow lines indicate caution.
The horizontal green lines are shopping areas.
The horizontal red lines are sales lines.
These supposed operations will be executed if other indicators or oscillators confirm the idea at the moment the price reaches the different areas.
You can see in this link how I projected the price and it was a perfect forecast BTC Technical analysis.
This is not an investment advice, it is only my analysis, I do not recommend that you trust my projection since I am not a financial advisor.If you liked the analysis and want more articles like this, you can leave a comment in the box below, you can also give a tip and you will be collaborating and keeping the spirit of the person writing.


