
Avalanche is one of the most popular cryptocurrencies that has been launched recently. It is also one of the major competitors of the Ethereum network. AVAX is the native currency of the Avalanche ecosystem. And with the early 2021 hype Avalanche has taken place a huge adoption due to its features and ease of use. Right now there is a lot of development going on in the Avalanche ecosystem. Here in this article we will look into the daily chart of the AVAX and analyze the chart. Before going forward in the analysis please read the following note carefully:
Note: The purpose of this Technical Analysis is to show the use of indicators and understand their meanings. So before making any financial decisions do your own research. Now sit back and enjoy the analysis!!
Support & Resistance
Just like in every other analysis we will start out Avalanche (AVAX) analysis by drawing the potential support and resistance zones so that we will get the idea of the area of domination of bears and bulls.
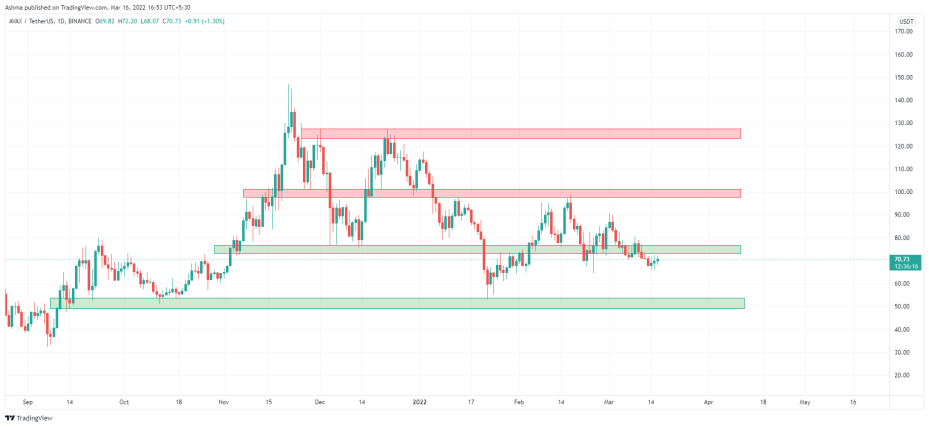
Current Support Zones
Primary Support Zone: $73 - $76
Right now the primary resistance zone has been broken out which is a sign of bearish movement ahead but yes the bulls are trying to survive right below the primary support zones and weaken the strength of the bulls can be seen at the primary resistance zone.
Secondary Support Zone: $50 - $53
There is a strong secondary support zone for the AVAX in case it is unable to hold the primary support zone. This secondary zone has not been tested in a while. Previously it has been partially tested in early 2022 and in the October of 2021. We will expect strong resistance to the price movement if bears carry the price to this level.
Current Resistance Zones
Primary Resistance Zones: $97 - $101
As you can see in the chart above that the primary resistance at ~$100 has been successfully tested recently and the price saw an immediate rejection from that zone. It suggests that the power of bears is way higher in that section and it is important for bulls to take that resistance in order to change the momentum in their favor.
Secondary Resistance Zone: $123 - $128
You can see that this secondary resistance zone has been formed in the late November of 2021 and after that, it has been tested once and the price got rejected so strongly that it has not been able to even retest this secondary resistance zone. If in bullish conditions bulls manage to break the primary resistance zone then the potential upward momentum is to this secondary resistance zone ~$125.
Descending Triangle and Bearish Breakout
As we have already seen that the price has been broken out downwards from the primary support zone and if you check the picture below you can see a pattern of Descending Triangle has also been broken out downwards. And if you see the rightmost part of the Descending Triangle where the price is trying to regain its position back into the triangle or simply retesting.
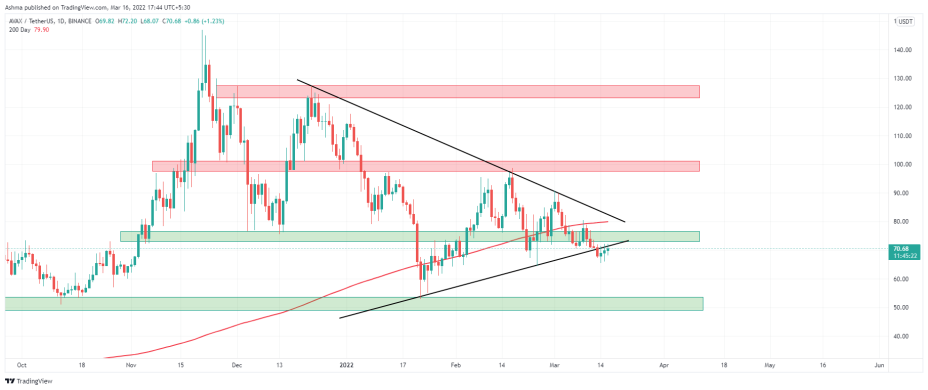
If the price managed to regain its position Descending Triangle then it will follow the triangle again in that case we will call it a fakeout. Otherwise if retesting gets successful then there is the possibility of more downward pressure.
What Are Indications From Indicators
We have seen the possible support and resistance zones and the ongoing breakout from the long Descending Triangle. Now let's get into the indicators and see what they are indicating about the Avalanche AVAX token on the daily timeframe.
Smooth Moving Average (SMA 200)
As you can see in the chart above the red dark line is on the upside of the current price candles, which suggests that the asset is in the downtrend. This adds confirmability to the downtrend theory that we have seen from the Descending Triangle breakout. In order to have a trend reversal, the daily price has to get over this SMA 200 line.
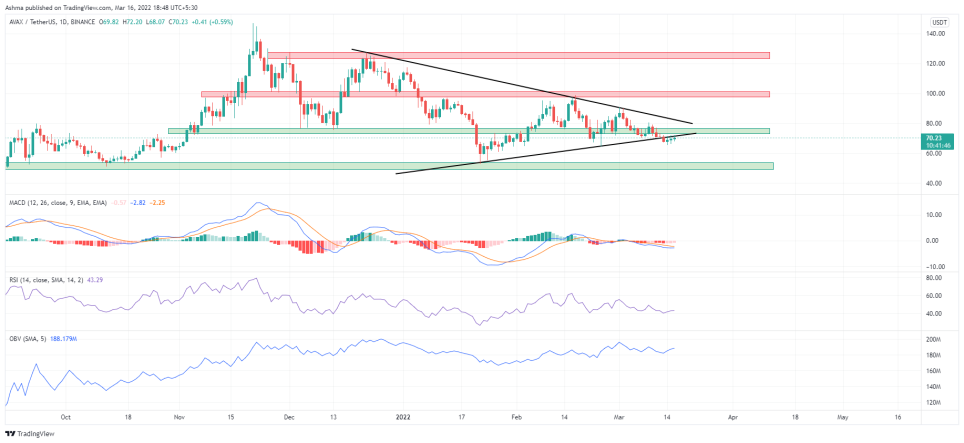
MACD & RSI (Moving Average Convergence Divergence & Relative Strength Index)
As we all know that the MACD gives us an indication of the trend reversal or the strength of the momentum. You can check the MACD signal line is below the MACD line which is a sign of a downtrend but looking at the MACD histograms we can see that the price has bottomed as the histograms are getting faint, indicating the weakening of the downtrend momentum.
And currently, the Relative Strength Index (RSI) is at ~43 (as RSI is less than 45) indicating the possible but not confirmation bearish momentum and as the RSI is not below 30, which indicates that the price has not been bottomed up, there is still the possibility of the downtrend.
On Balance Volume (OBV)
Any trader can tell you that the analyzing volume is one of the essential things in the technical analysis of any assets and On Balance Volume gives us the same rather more information about the volume. It gives us the difference between the volume on up days and the down days. You can check the OBV line at the bottom of the chart that is posted below. The slope of the last three days is positive means that the volume on up days is larger than the volume on down days suggesting the domination of the bulls in the market. But if you look at the most recent part of OBV then it is slightly getting flat which indicates that the bears are fighting back for domination.
Here is the complete trading setup of the AVAX/USDT chart on a daily timeframe:
Conclusion
After looking at the support and resistance zones, a breakout from the primary resistance zone, a breakout, and ongoing restest of the Descending Triangle, and lastly looked into the indications from the various trading indicators. So by considering all of them the price looks into the downtrend for right now. But there are still some confirmations needed to open short positions as the retest of the Descending Triangle zone.
Hope you like this analysis and this article. Do share your feedback about this analysis and share your opinion on Avalanche. Are you invested in Avalanche or in some of the projects in the Avalanche ecosystem. Thanks for your time and appreciation!


