
Compound Finance is one of the reputed projects in the crypto space. It is a platform based on the Ethereum network where users can lend or borrow assets and the interest is decided algorithmically based on the percentage amount that has been lent out from the pool. The Compound project is backed by some of the major investors in the crypto space like Coinbase Ventures, a16z crypto, Dragonfly Capital, and others which indicates the potential and sustainability of the project. Compound Finance has a native token called COMP which facilities holders a voting power in the crypto space, the COMP token has huge liquidity in the market and has a fixed supply of 10 Million tokens. In this article, we will look into the daily chart of COMP and look into some emerging patterns and other interesting stuff from the indicators. Before getting into the analysis please read the following note carefully:
Note: The purpose of this Technical Analysis is to show the use of indicators and understand their meanings. So before making any financial decisions do your own research. Now sit back and enjoy the analysis!!
Support & Resistance
As always we start our analysis by drawing support and resistance zones on the chart we will do the same for COMP analysis too. You can check the COMP/USDT chart of the daily timeframe with current support and resistance zones:
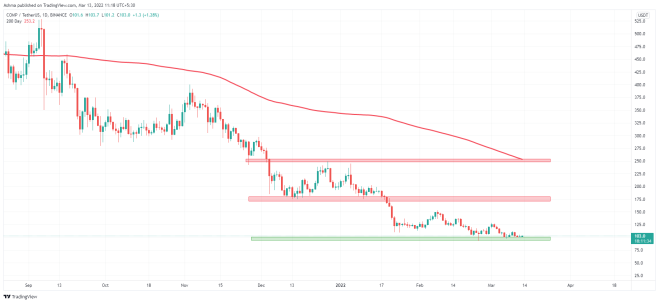
Current Support Zones
Primary Support Zone: $90 - $100
The current primary support zone is around $100 and is being tested at the moment of writing this article. There is no secondary support zone on the screen right now so it is more likely to hold the prices at this support level if not then there is a huge downward movement.
Current Resistance Zones
Primary Resistance Zone: $170 - $180
Previously this primary resistance zone acted as strong support for the price and now it is acting as a strong resistance zone. If the price holds above the primary zone and bounces back then the upward potential is up to this primary support level of ~$175. And if the price managed to break out from this primary resistance zone then the next secondary resistance zone is at ~$250.
Secondary Resistance Zone: $247 - $255
This resistance zone is a point of the previous breakout that ignited the drop-down so this is also a strong resistance zone and needed to be broken out in order to turn a long-term upward trend.
Falling Wedge
You can see the emerged Falling Wedge pattern on the daily time frame chart. The most probable outcome of the Falling Wedge breakout is a bullish move. But as you can see there is no confirmed breakout from the Falling Wedge so it will be important to wait for a clear breakout for the buy position.
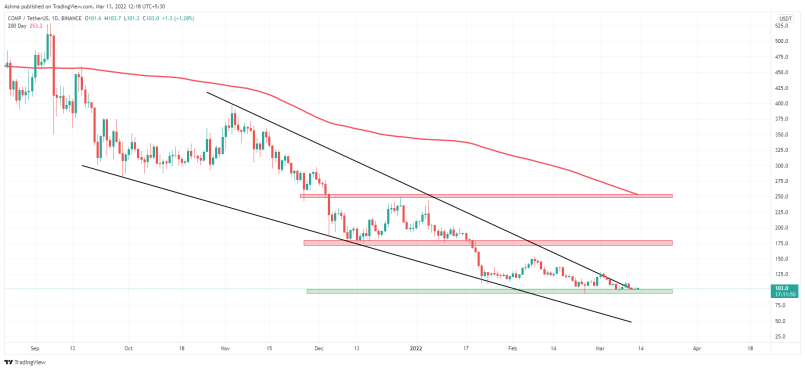
You can see in the chart above that a Falling Wedge is showing the signs of the breakout but yes it's still not confirmed. One good thing to notice here is that the price has strong support for breakout retesting. Most likely movement from here is a bullish breakout but still needs to be confirmed in order to be sure and open a trade.
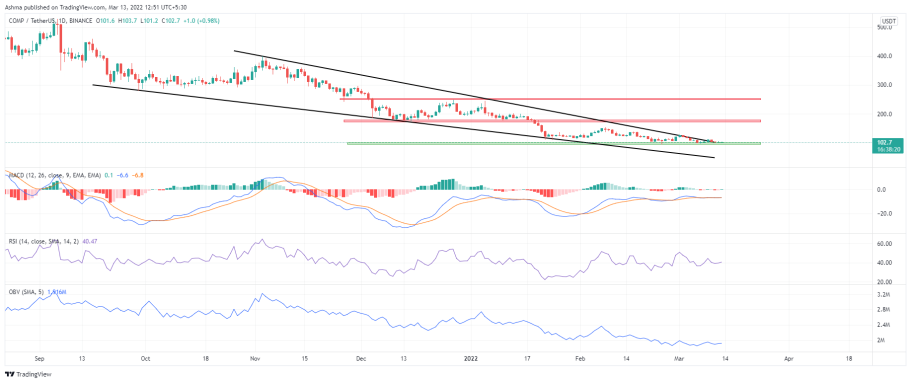
What Are Indications From Indicators
We have seen the support and resistance zones, and the potential bullish breakout from the Falling Wedge pattern, now let's look into the indicators to see what they are indicating about the market.
Smooth Moving Average (SMA 20)
Smooth Moving Average gives us a long-term trend indication of a particular coin. As you can see the SMA 200 line in the above two charts, the price is trading below the line which is an indication of the downtrend but with the potential patterns emerging in the daily chart, it will be interesting to see how long the price remains below SMA 200 and will surely take a test at SMA 200 line as a resistance breakout.
MACD & RSI (Moving Average Convergence Divergence & Relative Strength Index)
In the MACD indicator MACD line and the Signal, the line is almost overlapped on each other. And you can see in the chart the previous daily histogram is confused and not moving in any direction, which indicates the weak momentum right now. But for now, there is a crossover that suggests the bullish momentum, but yes the momentum is weak.
Yesterday's RSI closed at 93.48 and the current RSI is at ~40 which shows the bearish scenario as RSI below 45 indicates the bearish movement and the RSI above 35 indicates that the price is still not in the oversold zone.
On Balance Volume (OBV)
I consider OBV one of the main indicators in my technical analysis as it shows the difference between the volume on up days and the down days from which we can get the idea of whether bears or bulls are dominating the market. You can see the OBV line at the bottom of the chart below. Currently, it is almost a flat line indicating the volume on down and up days is almost the same and no one is dominating the market. Bulls and bears both are of the same strength for now.
You can see the entire trading set up in the chart below:
Conclusion
We have looked into the support and resistance, a potential bullish breakout from the long Falling Wedge pattern, and the indications from the various indicators. MACD is bullish with weak momentum and other indicators are neutral while the breakout from Falling Wedge & price is at support zone which indicates a possible bullish move but the buy position should only be opened after clear breakout which has not been happened yet.
Hope you like this analysis and this article. Do share your feedback about this analysis and share your opinion on Compound project. Thanks for your time and appreciation!


