
Crypto.com is surely one of the major projects in the crypto space. And as you all might know CRO is its native token and has a lot of utilities on the Crypto.com platform itself. And in my opinion, it is one of the undervalued tokens from the long-term perspective. In this article, we will look into the Daily chart of CRO/USD through the lenses of basic indicators and trading setup. We will look into Relative Strength Index (RSI), On Balance Volume, Moving Average, and current working Support & Resistance.
Note: The purpose of this Technical Analysis is to show the use of indicators and understand their meanings. So before making any financial decisions do your own research. Now sit back and enjoy the analysis!!
Support & Resistance Levels
Support and Resistance are the crucial levels for any technical analysis. The price of an asset is supposed to react on these levels either by bouncing back or showing a breakout, which can be utilized by a trader in his/her trading strategies.
Now let us get to the daily chart of CRO/USD pair on the FTX exchange, you can see the Support and Resistance levels on the chart below:
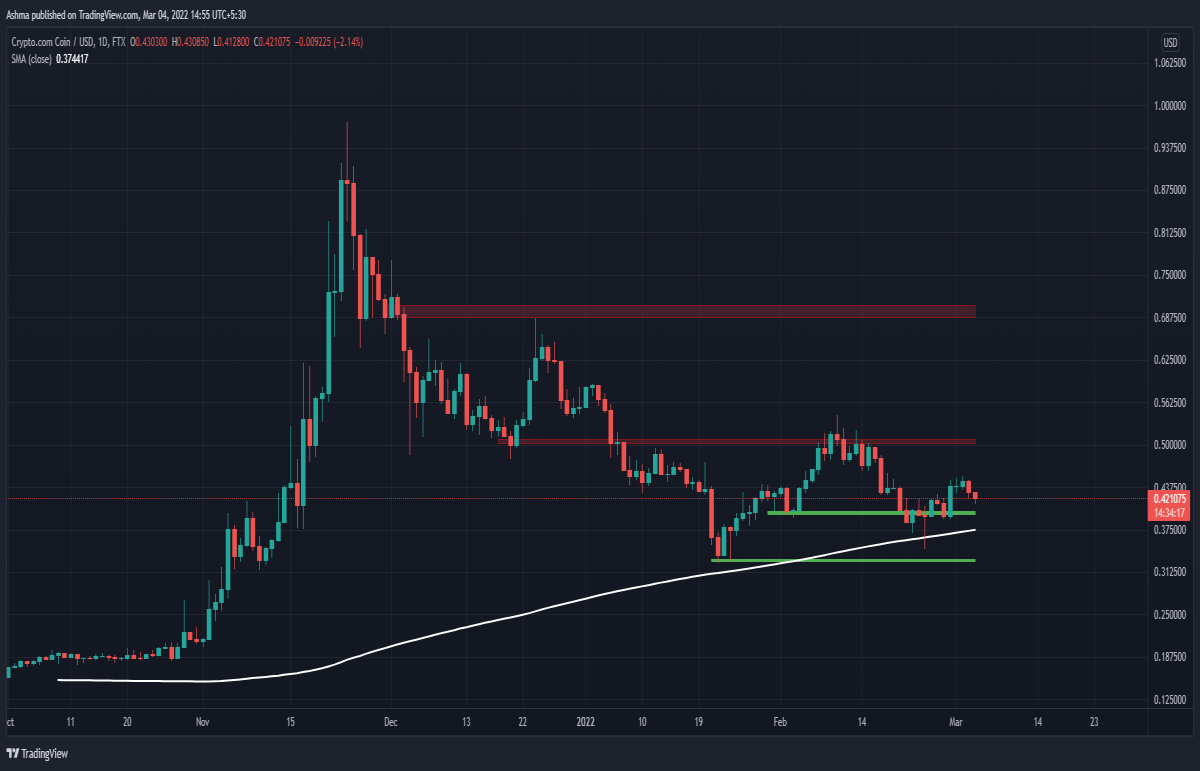
Current Support Levels are as follows:
Primary Support Zone: $0.39 - $0.40
Secondary Support Zone: $0.320 - $0.325
You can see that the price has bounced nicely from the primary support of $0.40 and is about to test that level again. If the price could not stay above that level then the next support is at ~$0.320 which has not been tested since January.
Current Resistance Levels:
Primary Resistance Zone: $0.50 - $0.51
Secondary Resistance Zone: $0.69 - $0.70
The price tried to break the primary resistance for almost a week but failed and drop down from there. And the secondary resistance zone has not been touched since December 2021.
What Indicators Are Indicating?
After looking into the Support and Resistance zones it is time to get into some of the basic as well as powerful trading indicators and see what they are indicating.
Smooth Moving Average (SMA 200)
The solid white line on the chart is a 200 SMA line. Moving Averages is one of the most popular trading indicators and is widely used by professional as well as retail traders. It is very easy to use and understand, if you are interested in learning more about MA check this article:
As you can see, the SMA 200 has been tested a few days ago and the price has been bounced off from that particular level. For now, the price is above the SMA line which indicates that the CRO is still bullish on a long-term scale.
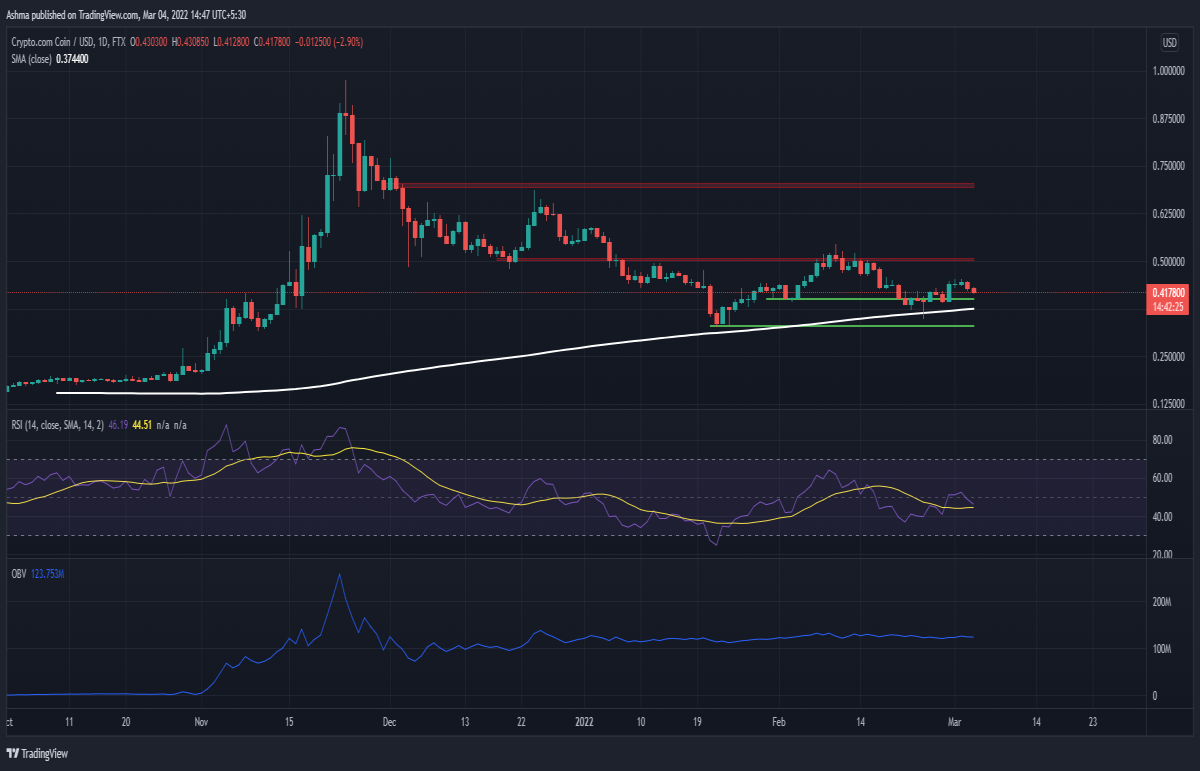
RSI (Relative Strength Index)
Another easy and very popular trading indicator used by many popular traders is to get the confirmations on their setups. You can see the RSI indicator right below the candles. The current RSI is around ~45 which shows the market is neither bullish nor bearish but is in the neutral zone.
OBV (On-Balance-Volume)
It is also a powerful trading indicator but not as popular as the above two, especially in retail traders. This indicator shows the difference in volume on Up & Down days. A downward slope of the line means the volume on down days is greater than Up days, hence the bears are stronger and vice versa for the bullish sentiment.
In the particular chart, the OBV line is flat, which indicates that the volume on Up days is almost similar to the volume on the Down days. We can predict that the market is in the neutral stage for now.
Conclusion
If we consider the indications from the Relative Strength Index and On-Balance-Volume then the market is in the neutral zone, both bulls and bears are of the same strength and no one is dominating the market. And from the Support & Resistance and SMA 200, then the price has a strong primary support.
Hope you found this article informative and learned the use of basic trading indicators. Do not forget to comment your opinion on the analysis and on the CRO token.


