
Yesterday I got my hands on a new MacBook Pro with the new M1 processor and Big Sur OS.
I was very excited since I watch Apple announcing it a couple of weeks ago.
As a seasoned PHP developer, mostly working with Laravel, I have been wondering if there will be a lot of issues setting my local environment.
In the past few years, I have been using Laravel Valet as the only tool I needed for my development.
So, first, I have installed everything I need and got my Laravel Valet up and running, and the projects I am working on are loaded and ready.
Time to do some coding!
Before I start coding, I always make sure that I have xdebug ready and running on my computer. I found it super useful and handy.
Lately, most of the coding time, I am using Visual Studio Code as the primary tool.
At the moment of writing this, I have not installed PHP Storm, which I am using for over seven years, and I pretty much master it. Will wait for JetBrains to make it native for my new baby :)
So, I installed XDEBUG, set everything, as usual, set a breakpoint in code, turn on extension, and… not works.
I check my php.ini, I print out phpinfo(), and found out that everything was fine at first glance.
In short, the problem was caused by me not paying attention that I am now working on xdebug 3, that has changed a bunch of things, so usual setup, I was used too for years,
like
xdebug.remote_enable = 1will not work anymore.
Install Xdebug on Big Sur
pecl install xdebug
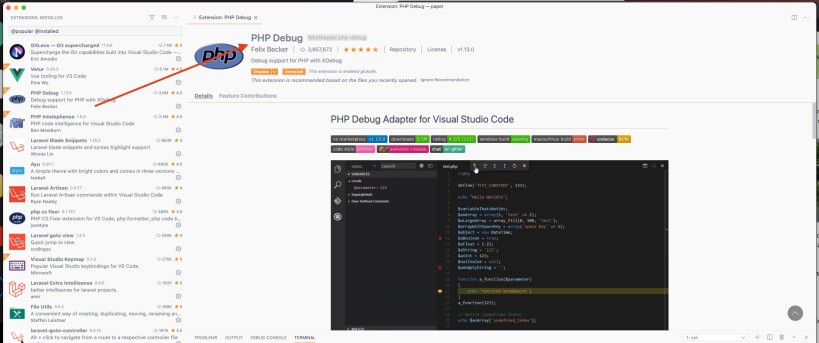
Visual Studio code
- press Shift+Command+X to bring up the Extensions window
- find extension PHPDebug by Felix Becker and install it
- press Shift+Command+D to open the Debug window
- Click on Cog(Settings) and change the port that is there by default, from 9000 to 9003(this is the new default port for xDebug)

Php.ini
open php.ini and add following:
xdebug.mode=debug
xdebug.start_with_request=yes
Restart valet and services.
Add break point in your file:
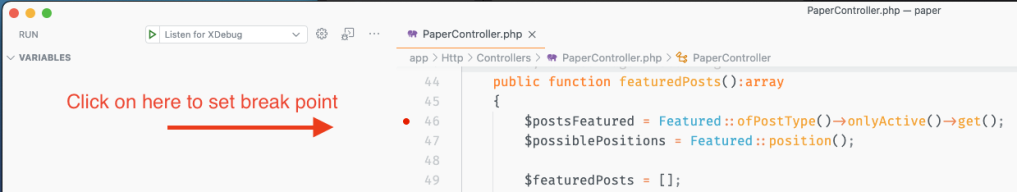
Turn on Debuger

Start debugging from browser, by clicking on Xdebug extension button, and reload the page you want to debug.
Once your code hits to xdebug break point, VS Code will pop and stop on your break point, where you can see all data you need for debug.

Happy Debugging and thanks for reading!


