
This article was published on Feb 8th
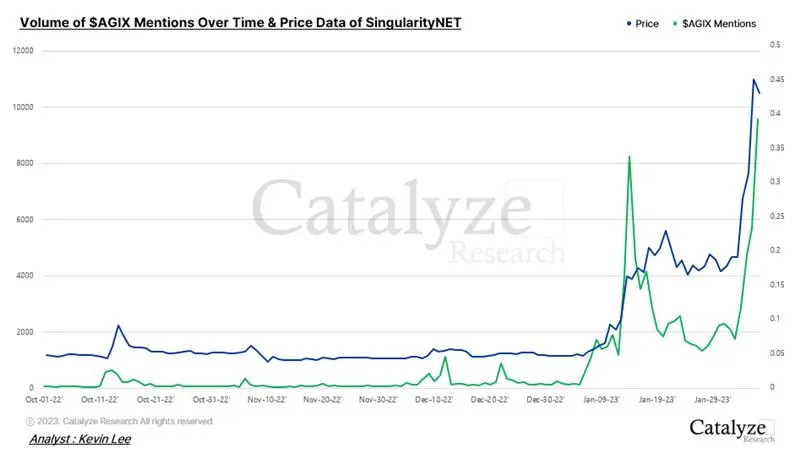
The chart above demonstrates the volume of $AGIX mentions over time, plotted along with the price data of the cryptocurrency.
The coin was listed on Binance on 14 Oct. 2022, and on the day of the listing, the coin pumped 188% above its daily close price. Interestingly enough, just a day before the coin was listed, the volume of mentions of the project increased a whopping 12x than usual, moving from 51 mentions to 630 mentions in a matter of a few days.
Afterwards, there weren’t any significant spikes in mentions of the coin or the project until 12 Dec., when the coin spiked 29% above its closing price. And although not visible on the chart above, as the price graph does not demonstrate wicks that candlestick charts otherwise would, on 14 Jan. 2023, we saw a massive spike in the volume of mentions, as $AGIX moved close to its all-time highs for the first time since its listing, making a 59% wick above its closing daily price.
Since then, the coin has rallied 276% from its local lows, and the volume of mentions also demonstrates a similar move to the upside, moving from 1338 mentions on 27 Jan. to 9574 mentions as of today.
Despite what is presented to us visually, the volume of mentions for $AGIX does not serve as a leading indicator of price action, but rather a parallel, if not lagging, indicator that quantitatively substantiates the hype behind calculated price actions taking place in the market. We can, however, use this as a leading indicator to identify massive spikes in mention volumes before a certain cryptocurrency enters its price discovery phase.





