
Decentralized exchanges incentive traders to provide tokens in crypto trading pairs. In return, these liquidity providers earn passive income on their pool share.
Two opposing behaviors in LPs: Add Liquidity & Remove Liquidity, which reflect their different attitudes toward a particular token.
Understanding Add/Remove Liquidity
Add Liquidity: LPs put tokens to the trading pairs because they believe more traders will trade with this token and generate trading fees. It is an optimistic action as these added tokens are transferred to the DEXs.
Remove Liquidity: LPs remove tokens from the trading pairs and give up future rewards, most likely for selling.
Since the behavior of liquidity providers affects token prices, we have developed five exclusive metrics and three features on the “Explore” page to help you sniff out price changes before sell-offs or pump-ups.
Token Liquidity Indicators
- Net Add Amount for Liquidity (with Smart Money Mode)
- Top LPs by Total Value Locked (with Smart Money Mode)
- DEX Liquidity
- Liquidity Providers (with Smart Money Mode)
- Live Trading – Add/Remove Liquidity (with Smart Money Mode)
Explore Page Features
- Top liquidity Add $ (with Smart Money Mode)
- Unique New LP (with Smart Money Mode)
- Live Trading: Large Orders in 24h (with Smart Money Mode)
Indicators for Liquidity Change & Price Prediction
These metrics monitor the daily changes in liquidity amount, value and LP numbers.
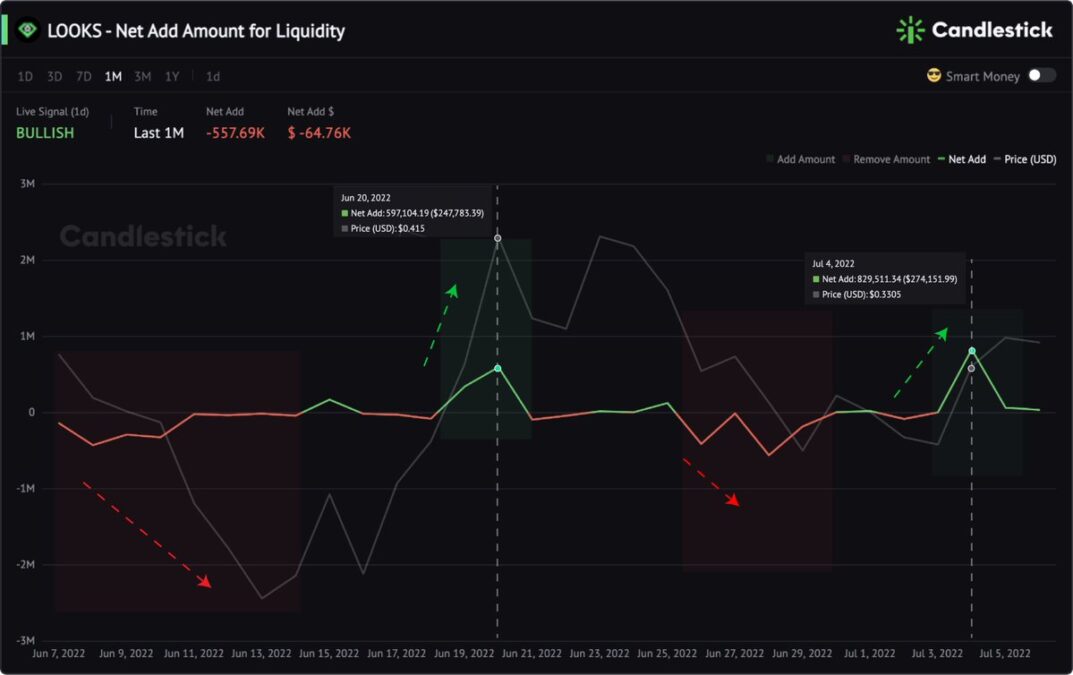
Net Add Amount for Liquidity
Indicator: Net Add Amount for Liquidity
Formula: Add Liquidity Amount – Remove Liquidity Amount
Condition: >0
Signal: Bullish
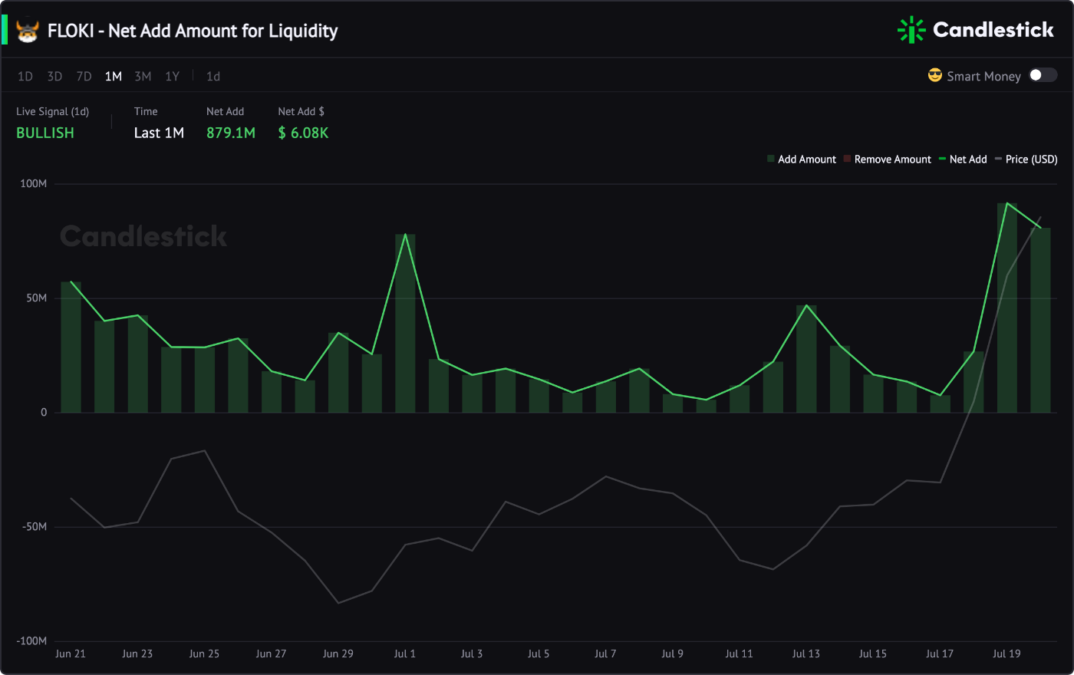
This indicator helps to determine what might happen before the price changes.
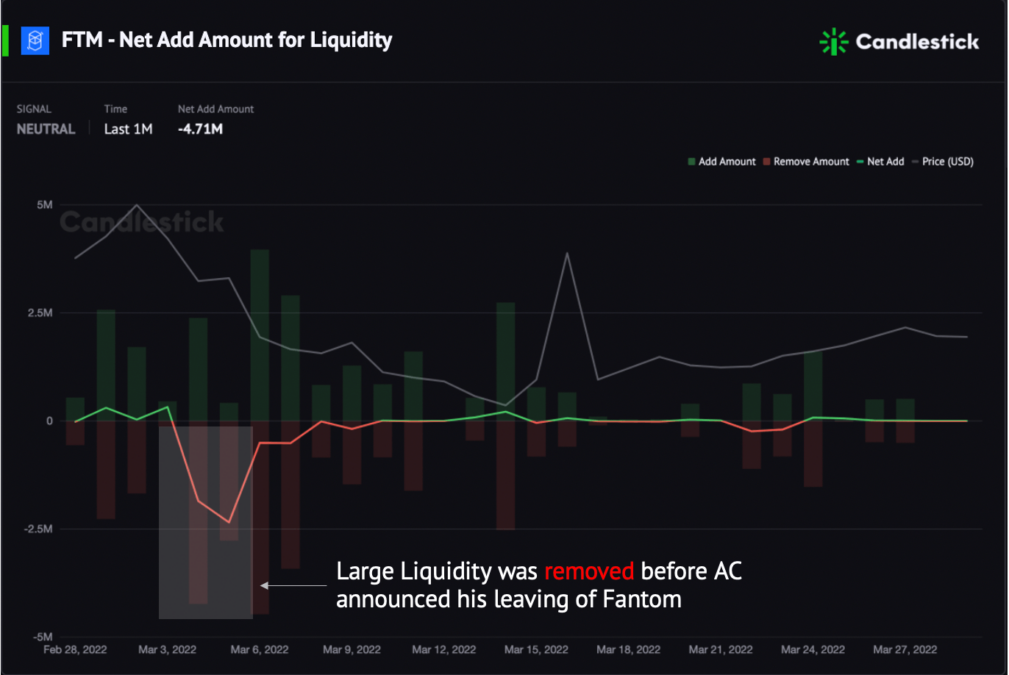
Large Liquidity was removed before AC announced his leaving of Fantom.
This indicator correlates with the token price in most cases.
Take the LooksRare (LOOKS), for example; in 30 days, the Net Add Amount for Liquidity Indicator correlates with the price. When the indicator is red, the price falls, and when it peaks, there is an uptrend.
We provide 5 minutes, 15 minutes, 1 hour, 1 day, 7 days, and 1 month resolution in this metric. Check this tutorial for more information: Metric Handbook: Net Add Amount For Liquidity
Liquidity Providers
Indicator: Liquidity Providers
Condition: Increase
Signal: Bullish
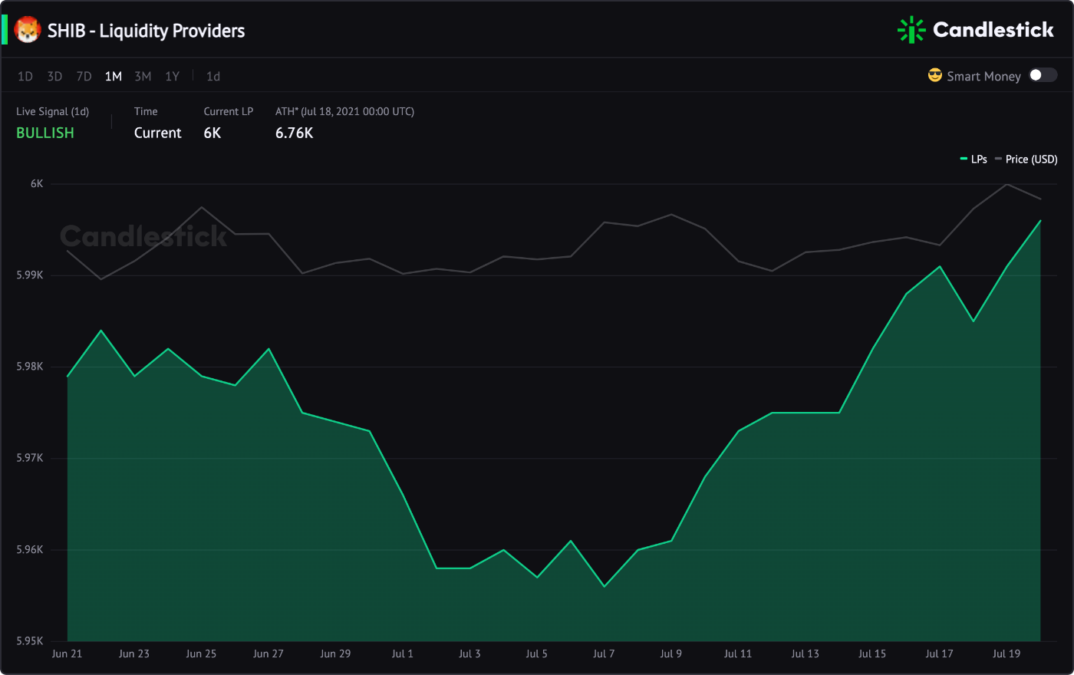
A long-term change in this indicator reflects the sentiments of traders. If more traders are willing to become liquidity providers, they are optimistic about the future of the token and are less likely to sell.
Let’s go back to the LooksRare (LOOKS) example. In 3 months chart, the number of $LOOKS liquidity providers on Ethereum bottomed out on June 18 and has been climbing since then, accompanying the price reversal.
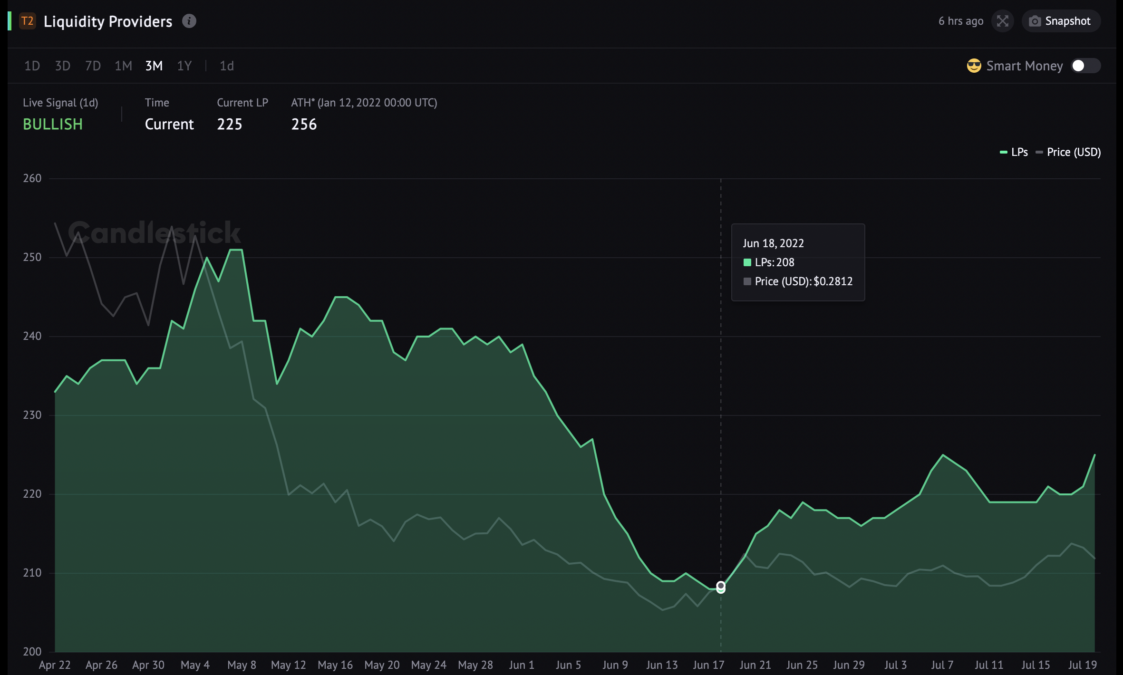
Check this data guide to learn more: Liquidity Provider
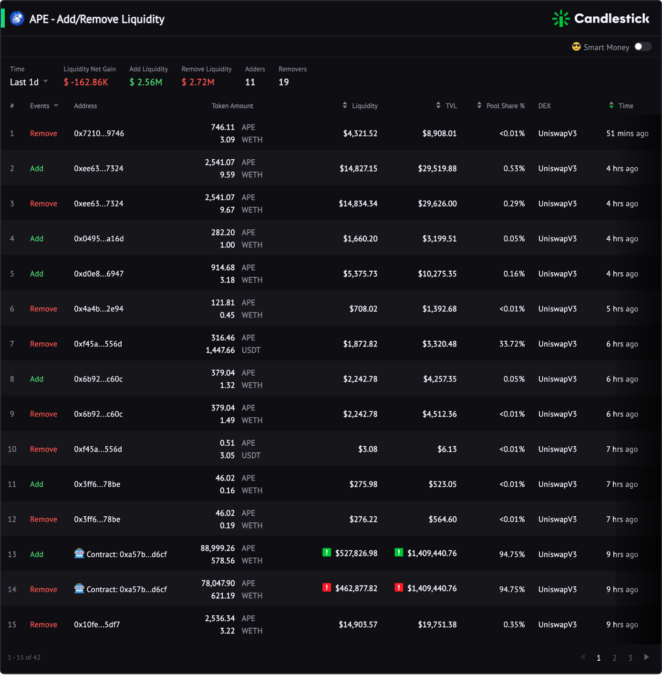
Live Trading: Add/Remove Liquidity
We display the real-time Add/Remove liquidity feeds in the Live Trading metric group. You can track every single transaction of Liquidity here.
For example, Unisocks (SOCKS) Liquidity saw bullish signals on Jun 23 with a net add liquidity value of $312.73K and DeFi OG contributing $213,64K in 24 hours.
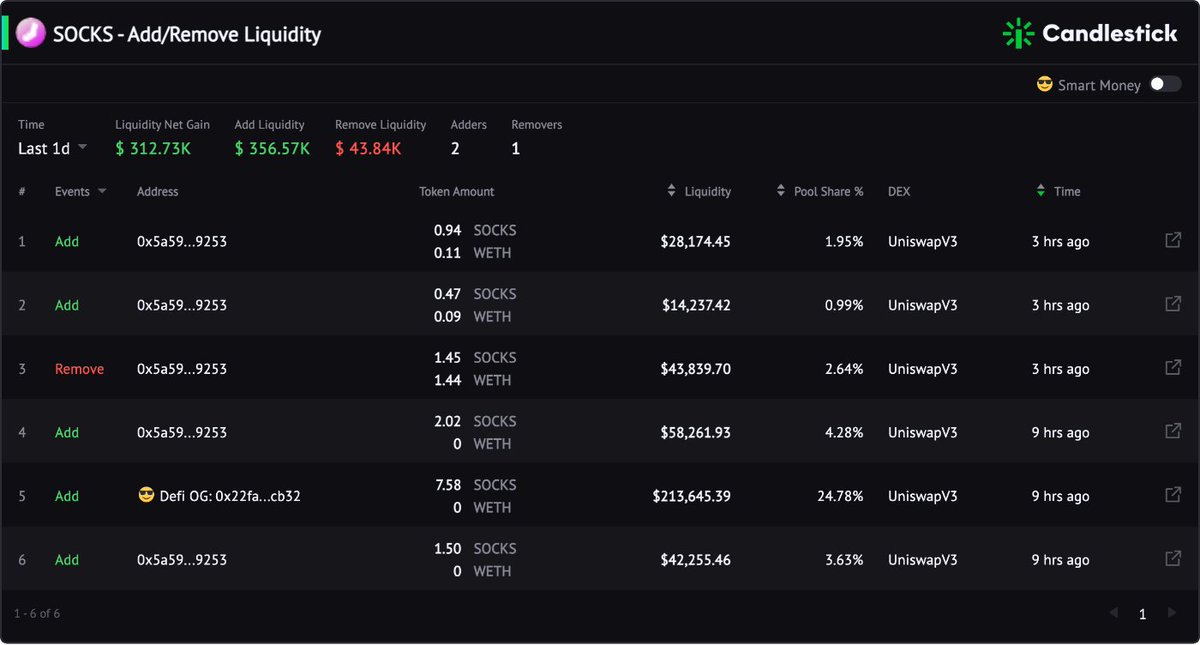
When we write this trader tip, the price of SOCKS has broken $37,896, and this clever liquidity provider hasn’t removed the liquidity yet.
Explore Page for Real-Time Liquidity Change Alerts
This is a perfect place to get a real-time glance for large liquidity added tokens in the last 5min, 1h, 1d & 3d.
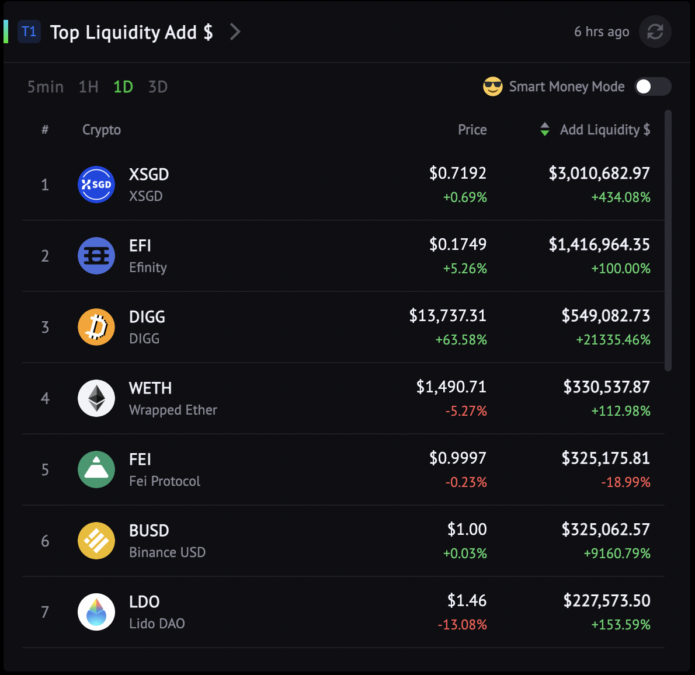
Top liquidity Add $ & Unique New LP
On the “Explore” page on Candlestick, there are two exclusive leaderboards to rank tokens by liquidity added value & lp count changes.
The Top Liquidity Add $ list ranks tokens by Liquidity value-added on decentralized exchanges.
The Unique New LP leaderboard ranks tokens by the number of unique new liquidity providers on decentralized exchanges.
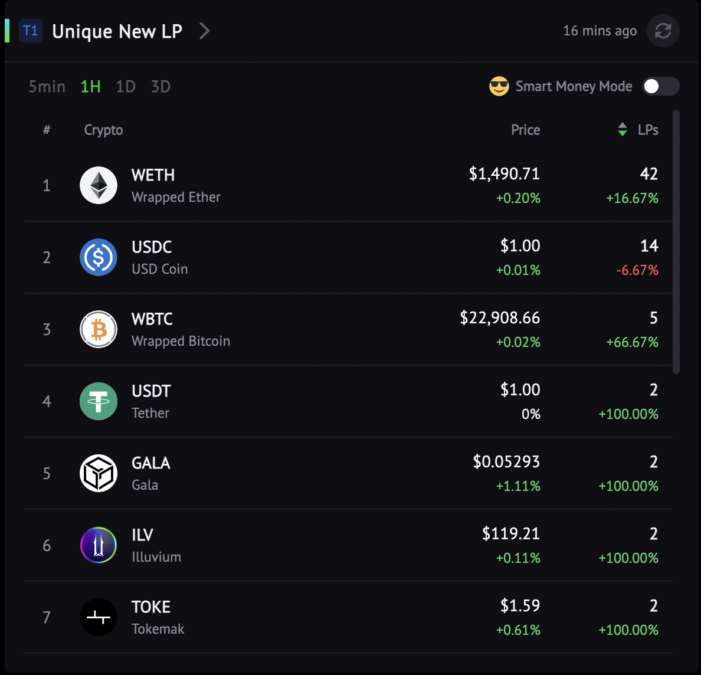
Find crypto gems by checking tokens with large liquidity added by traders and Smart Money.
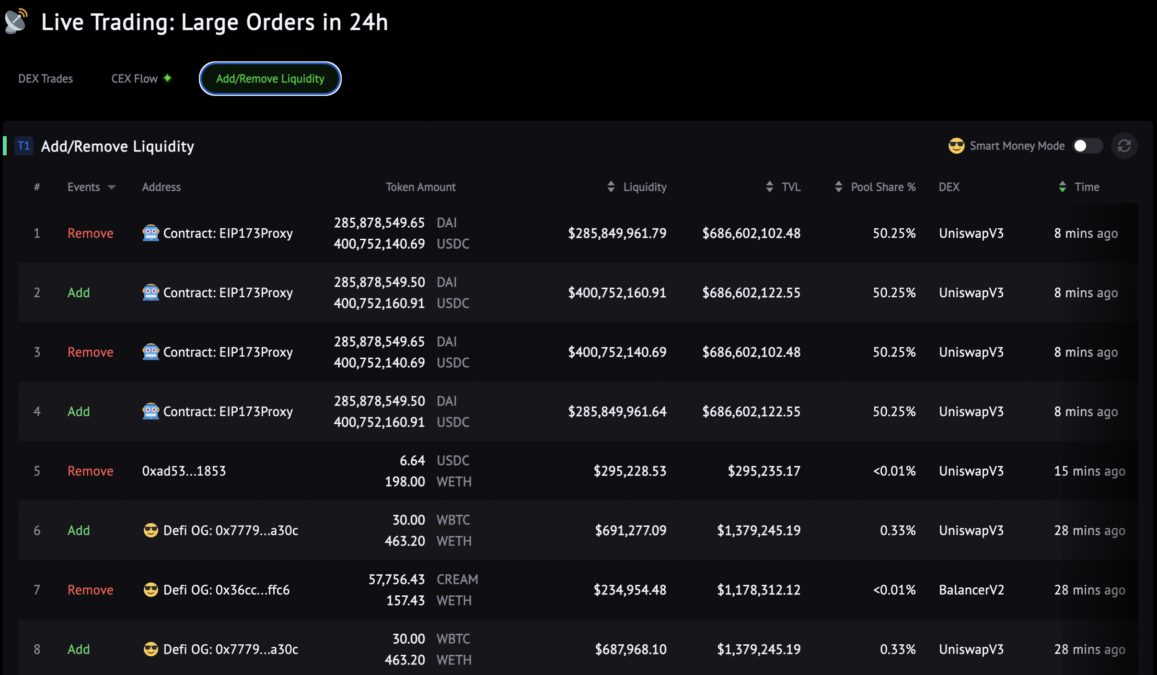
Live Trading: Large Orders in 24h
The Live Trading section on the “Explore” page broadcasts real-time liquidity changes from 40+ decentralized exchanges. This function reports every added or removed liquidity transaction that values ≥$100K.
Always Turn on Smart Money Mode
Smart Money has more expertise and broader information than the average investor. Therefore, their actions generally reflect price changes in advance.
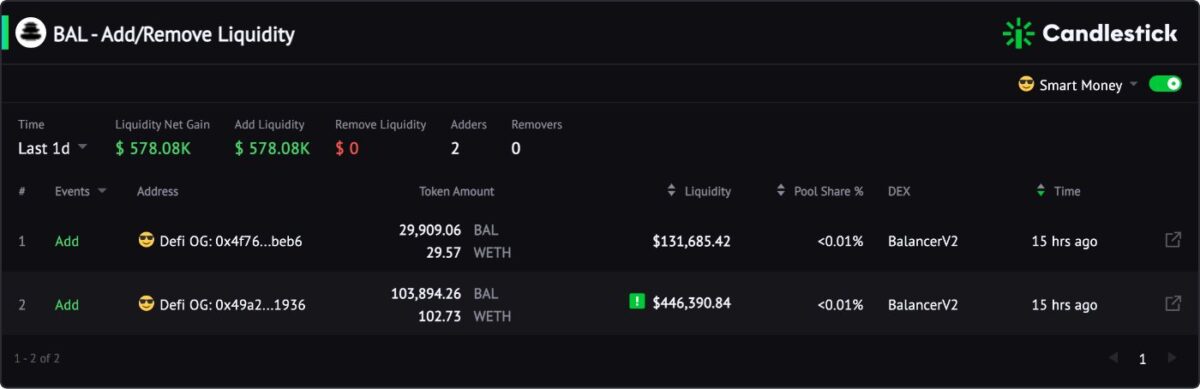
On Jun 17, we observed that while Balancer (BAL) price was falling, $BAL Net Add Amount for Liquidity showed positive signals. It surged 4,966%, and the added amount was 29x of the removed amount on Jun 16.
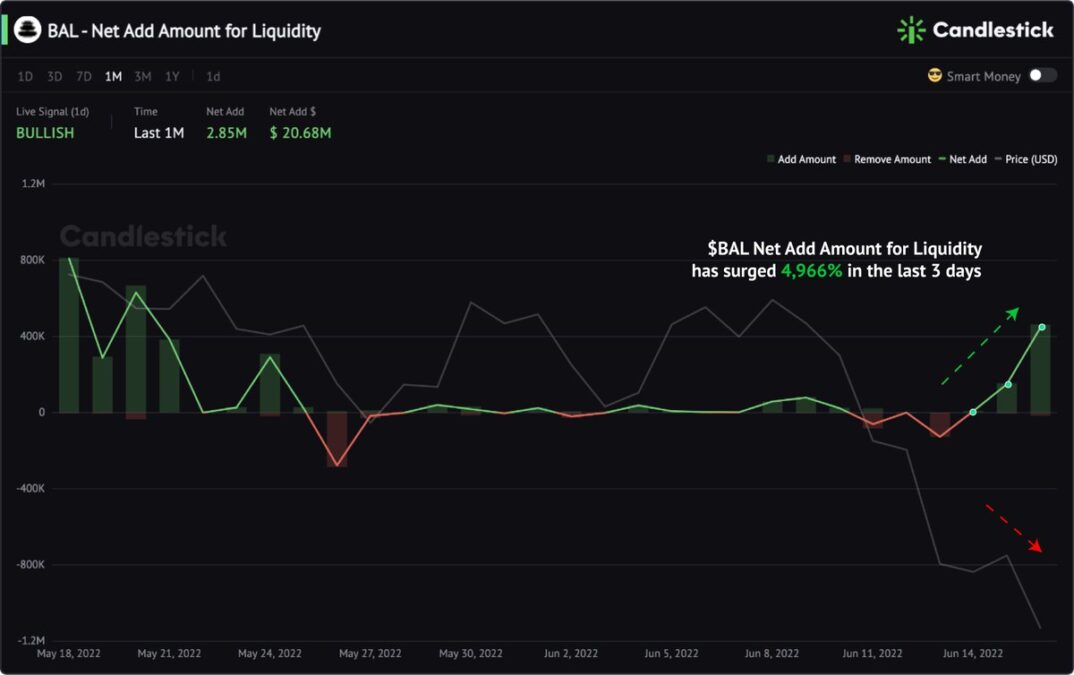
Smart Money Add/Remove Liquidity chart showed Defi OG was confident in the Balancer token as they added $578.08K liquidity that day.
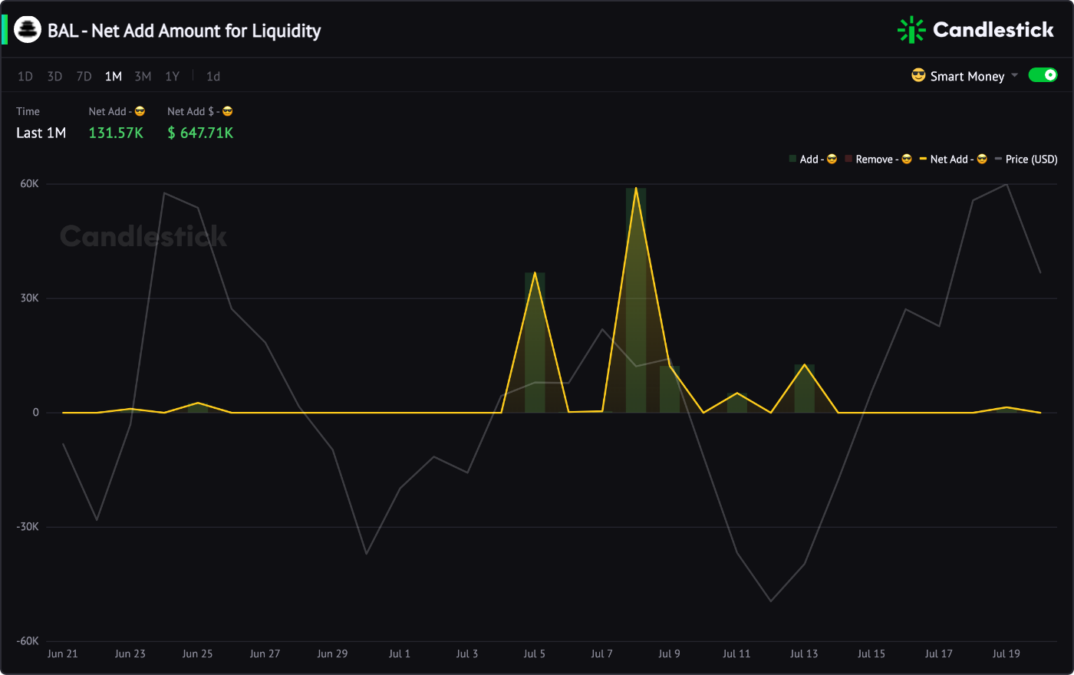
Now the Balancer token has rebounded to $5.68, and the 3-month chart shows that Smart Money is a diamond hand and never removed a single coin of Liquidity over the three months.
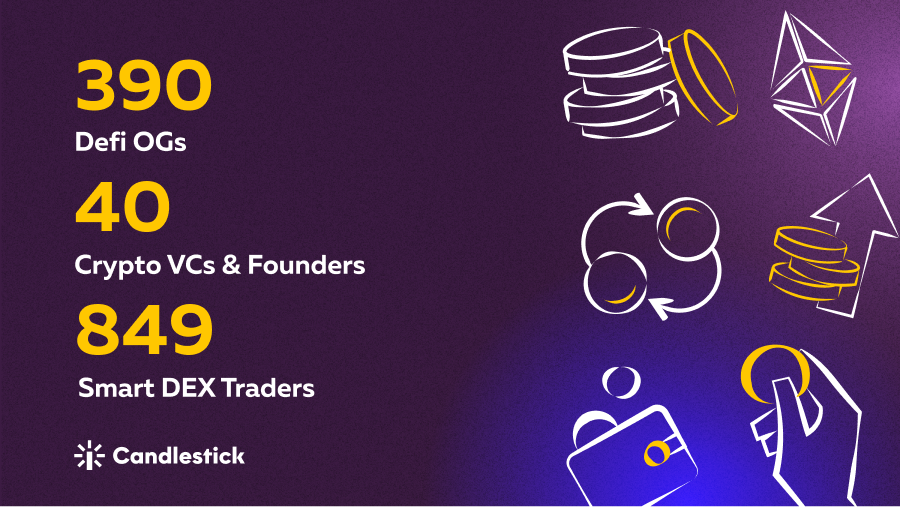
Candlestick labeled 1139 Smart Money addresses, including 390 Defi OGs, 40 Crypto VCs and founders, and 849 Smart DEX traders.
You May Also Like
- How to Create a Daily Workflow to Find GEMs on Candlestick? 3 Steps
- Why do CEX Flows Matter in Crypto? How to Trade Net CEX Flows? 4 New Signals
- How to Gain Profits in The Crypto Bear Market? 3 Tips for Traders


