
TSUKA - How to get on board this top gainer today?
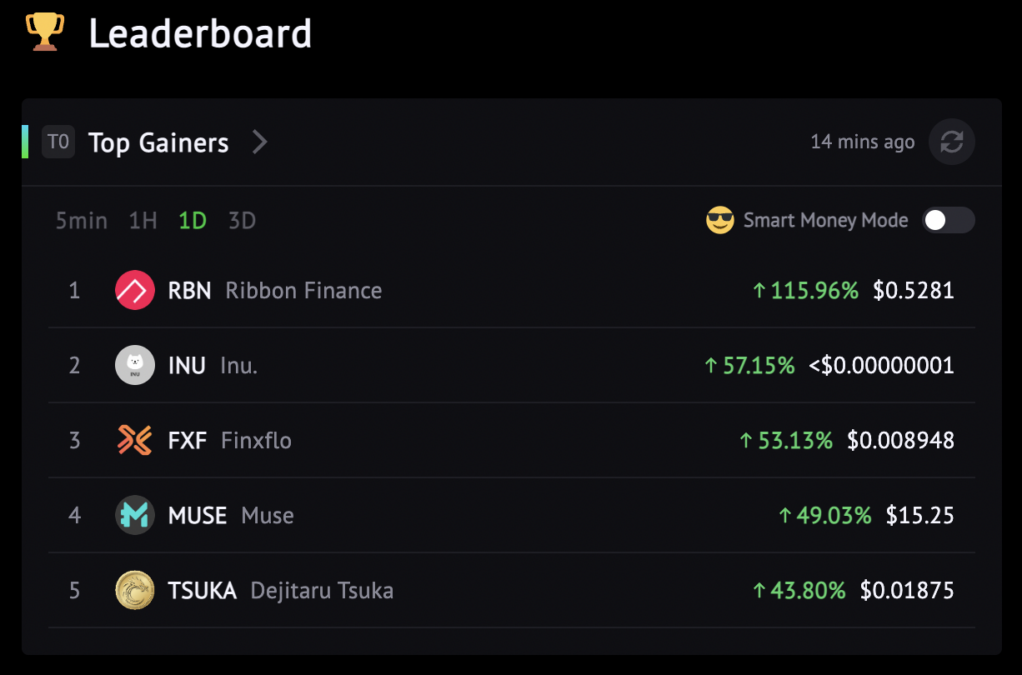
TSUKA is one of the top gainers today, +43.80%.
Candlestick alerted its bullish signal on Jul 15 when the price was $0.009332. It then went up 103% to $0.01895 at the moment when we wrote this newsletter.
How do we find this gem?
As we share on the Alpha Trader Tips – a daily workflow to find GEMs on Candlestick. The first step is to check “Explore” token lists frequently.
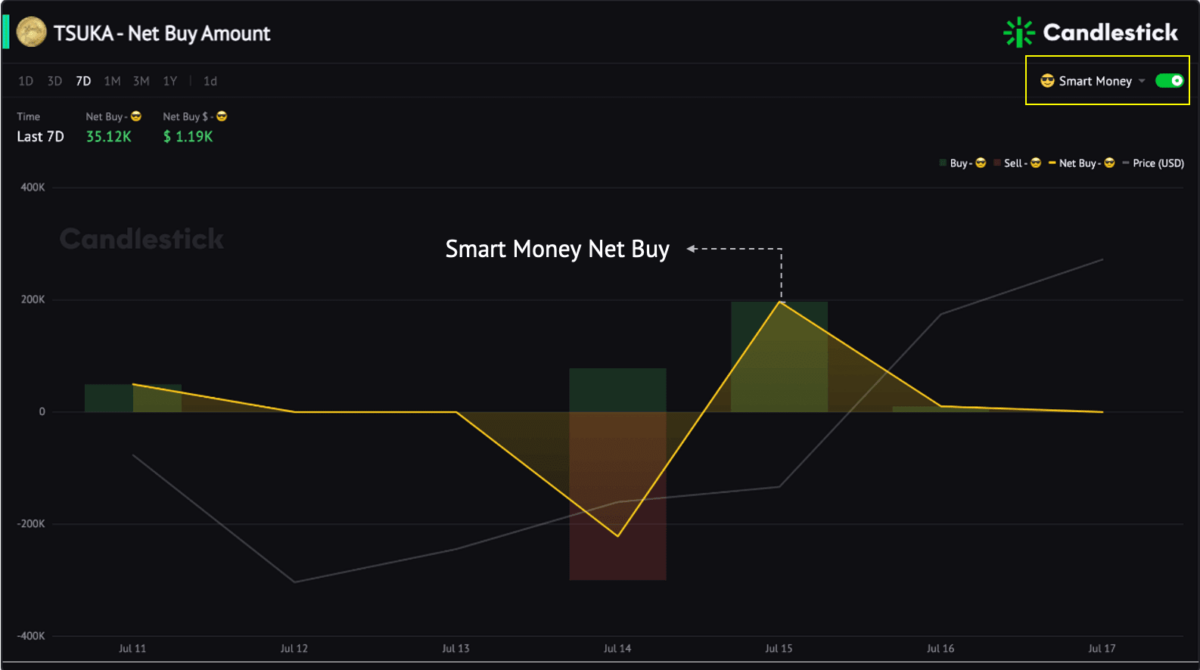
We noticed that TSUKA is in the Top Net Buy Value by Smart Money token list on Jul 15. Click on it to check TSUKA Net Buy Value token metric, and turn on the “Smart Money Mode,” we can see that on Jul 15, smart money buy TSUKA at $0.009332.
Check the Live Trading – DEX Trades to better understand who are buying. Remember to turn on the “Smart Money Mode.”
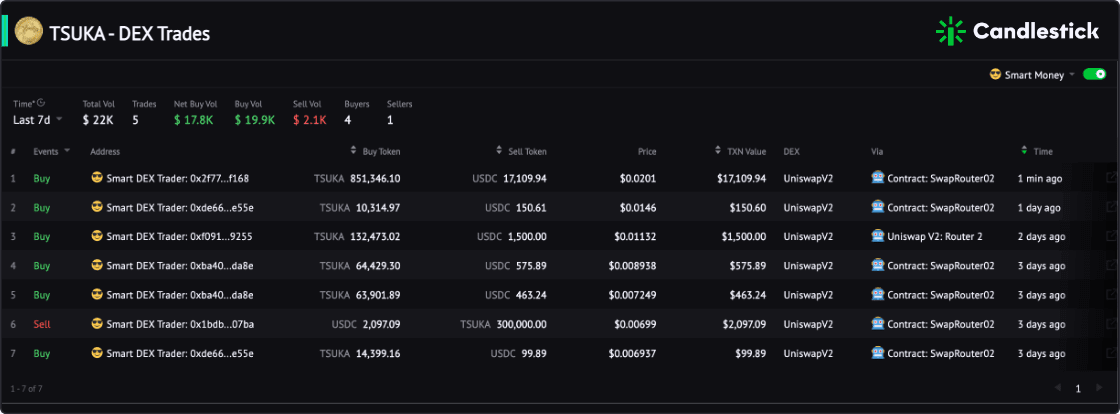
Smart Money continued to buy in gradually 3 days ago. The latest buy order happened 1 min ago when we wrote this newsletter, and it is the largest Smart Money buy order so far $17,109.
WETH - An Apparent Price Resistance at $1,847
WETH/ETH +42% from $1,037 to $1,467 since Jul 12. How long will this uptrend go? 2 signals you need to know.
WETH Avg Hodl Price
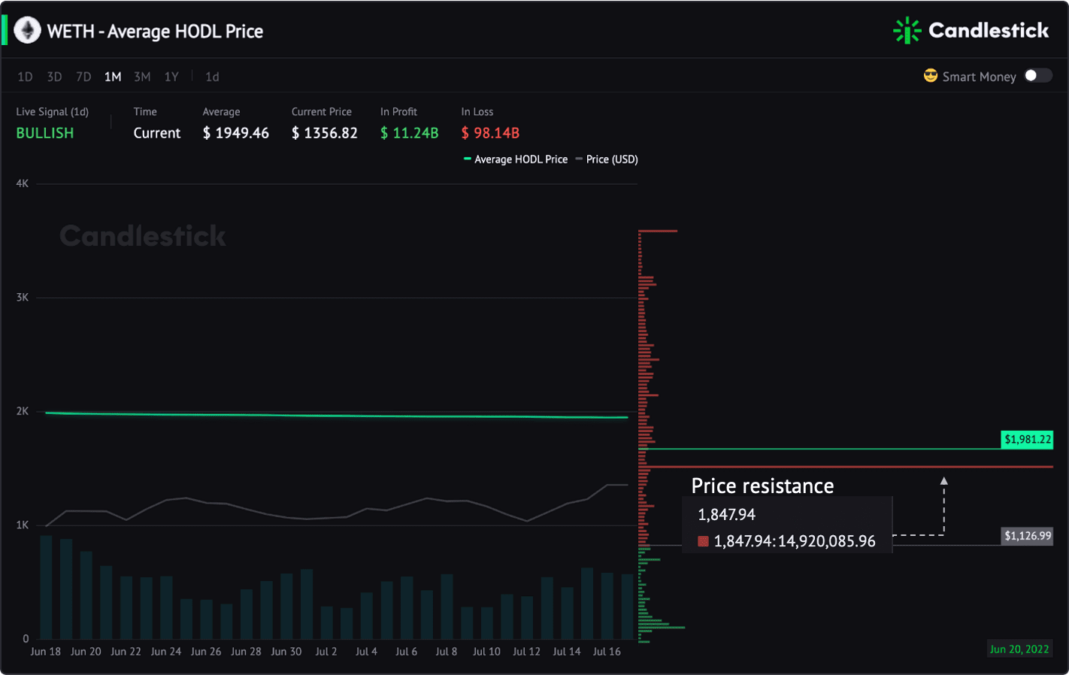
WETH Avg Hodl Price is $1,949, much higher than the current price. Hence, most of the holdings are still at a loss. These holders tend to keep it till the price recovers.
However, there is an apparent price resistance shown on the Position Cost Distribution chart (the left graph). The resistance price is $1,847, with 14.9M WETH purchased and are still holding at this price.
👉 How to use the Position Cost Distribution metric?
LOOKS - Up 22% Today. 2 Signals to Alert
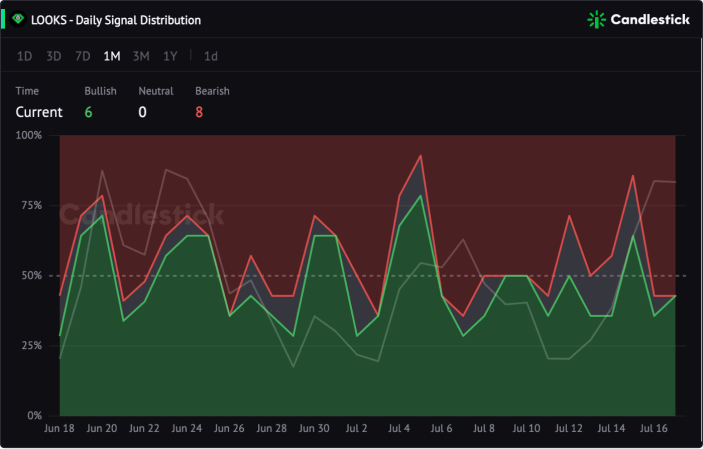
Candlestick Daily Signal Distribution chart shows the percentage of bullish & bearish signals of the token on a daily basis. If you are a short-term trader, you can check the real-time 5min, 15min & 1h signals distribution to capture the swing trading profits.
See the correlation between the LOOKS Signal Distribution chart and the LOOKS price. The bullish signals distribution drops a bit.
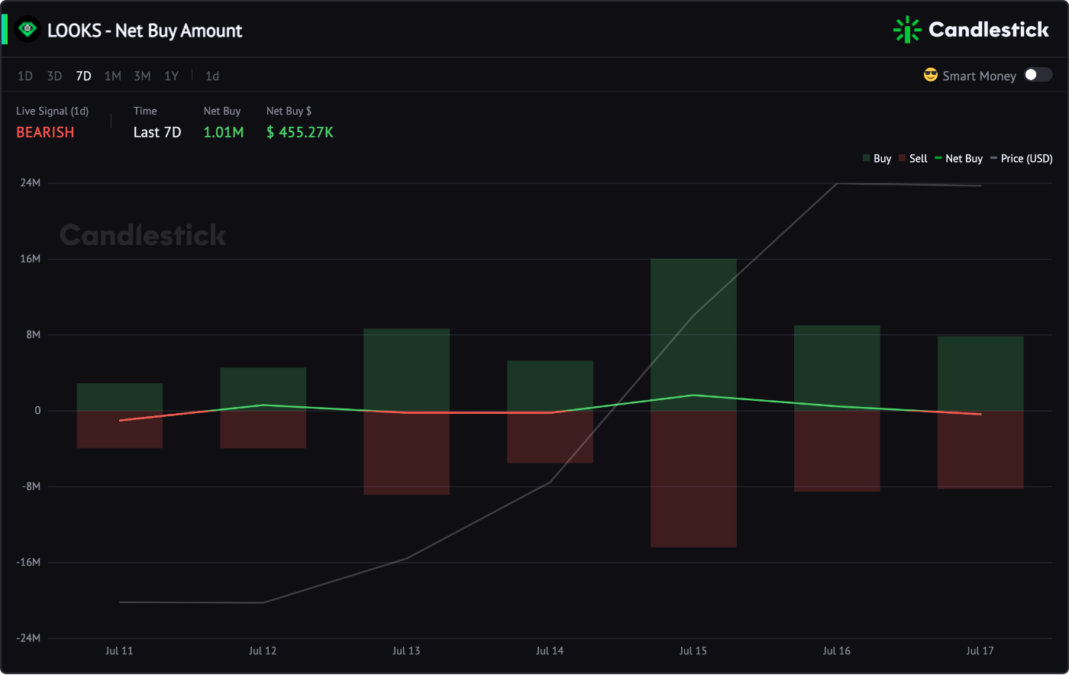
The Net Buy Amount is not as strong as the price uptrend. Rather, it is fading and turning negative.
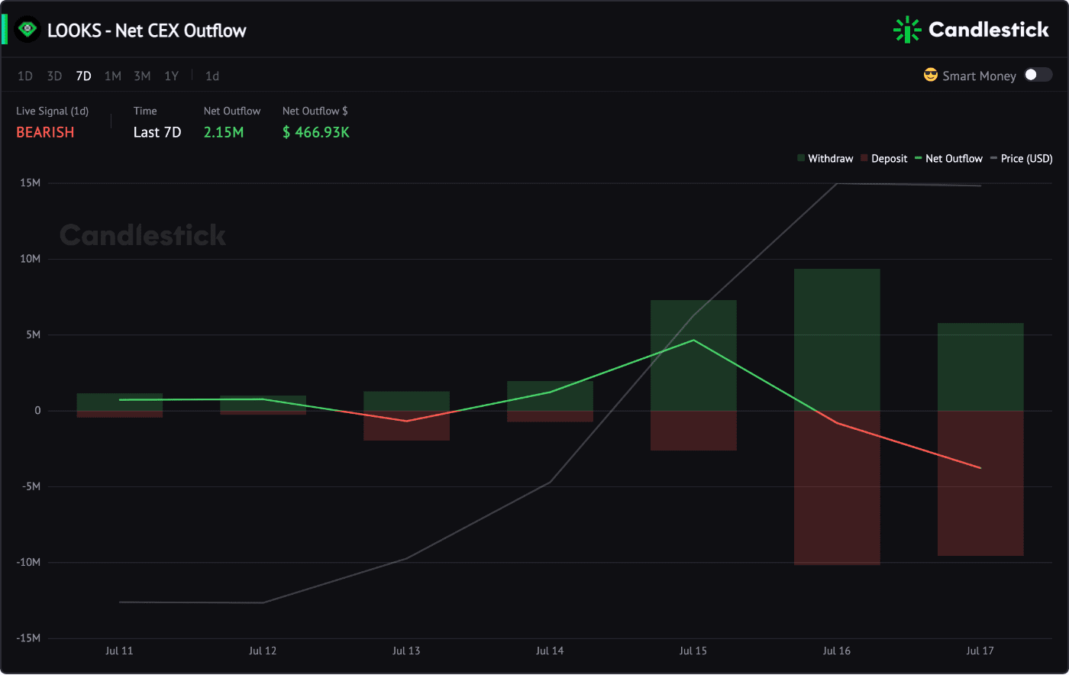
The Net CEX Outflow turns negative when the price surges to $0.4. It means traders are transferring LOOKS tokens to CEXs, most likely to sell.
Combining the Net Buy Amount metric & the Net CEX Outflow metric, it indicates that traders tend to sell LOOKS when its price increases above $0.4.
👉 Why do CEX Flows matter in crypto trading?
Free access to T0 metrics!
- 3 lists include Top Gainers, Top Losers, & Top Trading Volume.
- 13 trading signals: Live DEX Trades, Add/Remove Liquidity, Holders, etc.

Need more for alpha trading?👇
Unlock all features for only $3.3/day.
You May Also Like:
- Why do CEX Flows Matter in Crypto? How to Trade Net CEX Flows? 4 New Signals
- How to Create a Daily Workflow to Find GEMs on Candlestick? 3 Steps
- How To Explore Crypto Gems?


