Tokens In Your Bag Surge Today? How to profit at a bit higher price than others?
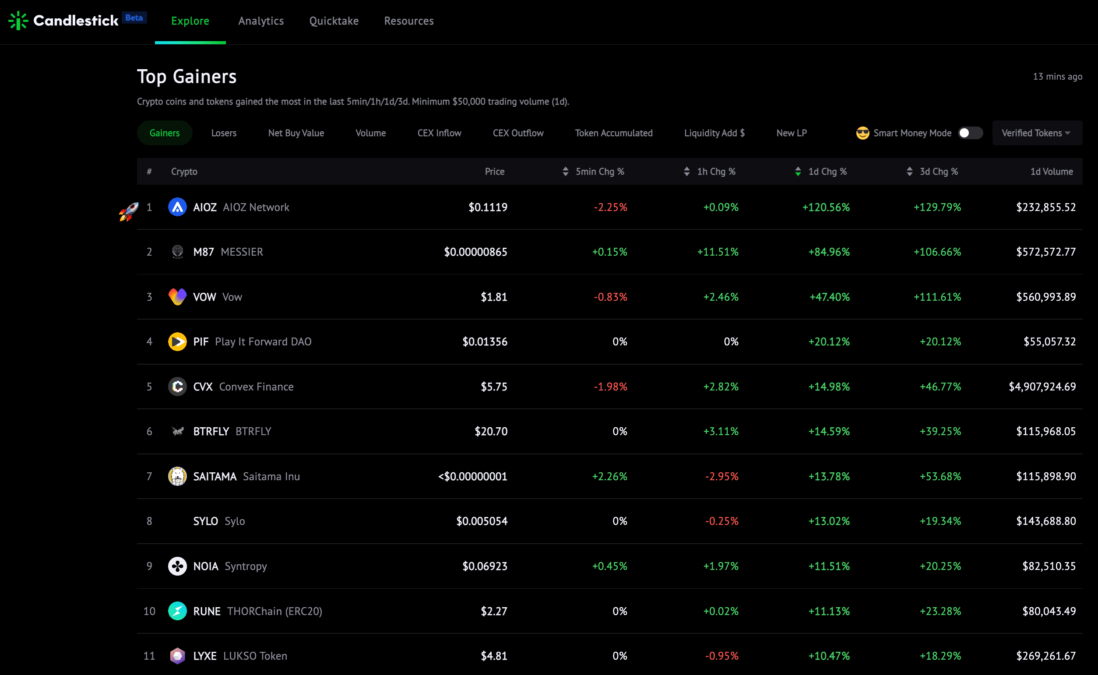
AIOZ is the Top Gainer today +120% 24h.
AIOZ is the No.1 top gainer in 1 day and 3 days.
If you are holding AIOZ, how to profit at a bit higher price than others?
Monitor CEX flows
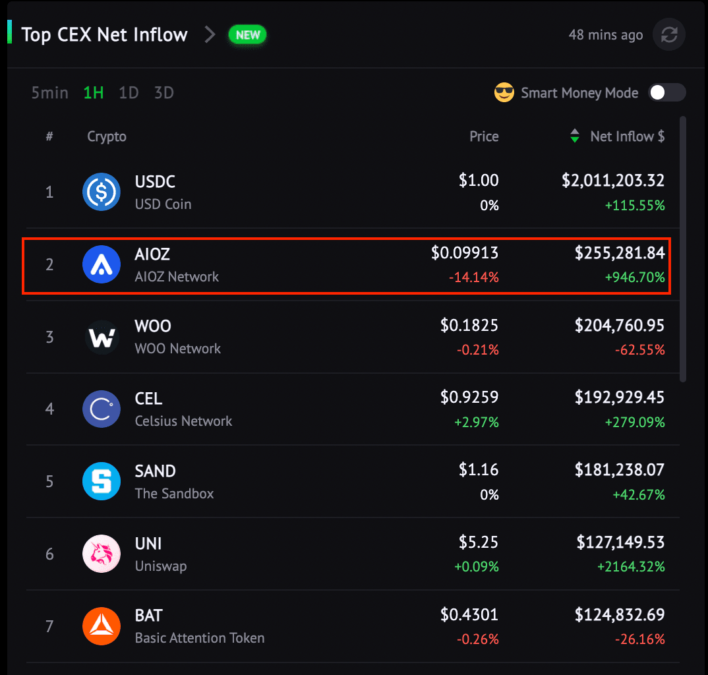
- Step 1: Go to the “Explore” page –> Top CEX Net Inflow
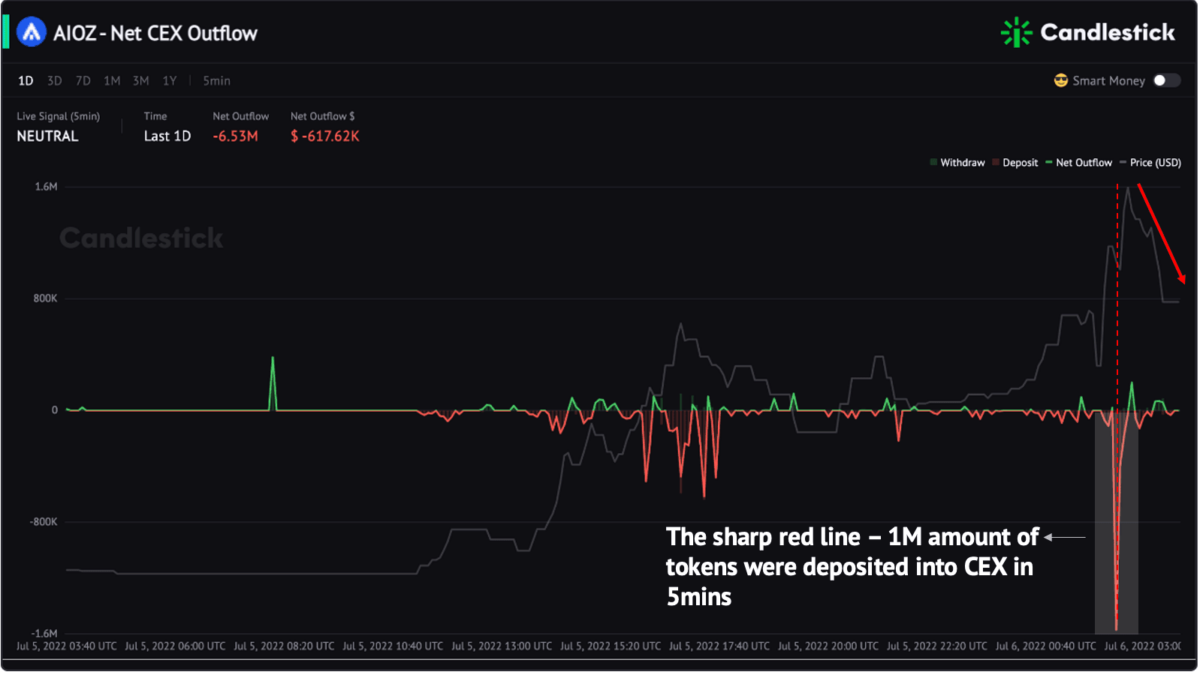
- Step 2: Click on the token and check its CEX Outflow chart.
- Step 3: If a sharp red line occurs –> token price tends to drop in short-term
CEX inflow is a very practical signal if you are a short-term trader. It can help you get a better exit price.
Take AIOZ for an example
The Top CEX Net Inflow list on the Explore page alerts a large amount of AIOZ transferred to CEX in 1h.
Click to check the AIOZ Net CEX Outflow chart, there is a sharp red line – 1M amount of tokens were deposited into CEXs. The token price drops 17% after this signal occurs.
CEX inflow is a very practical signal if you are a short-term trader. It can help you get a better exit price.
SHIB - Burnt vs Staked
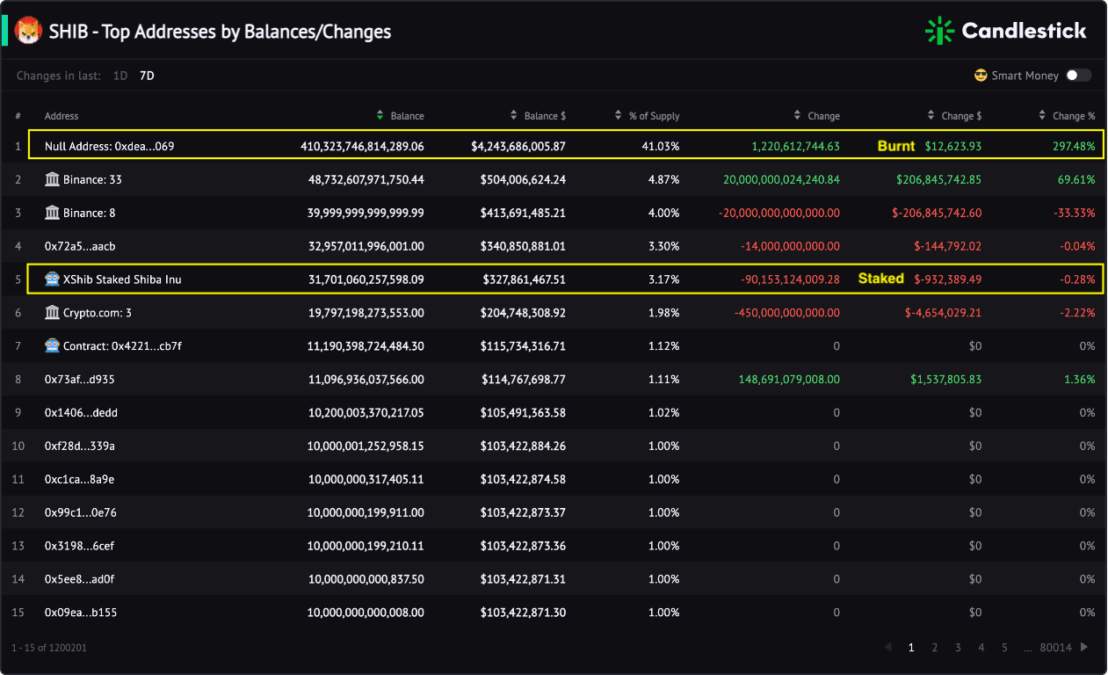
In the past 7 days, $12,623 worth of SHIB was burnt. While the $932,389 value of SHIB tokens were removed from the XShib Staked Shiba Inu pool.
If you are a SHIB trader, monitoring the changes of these 2 addresses is a MUST.
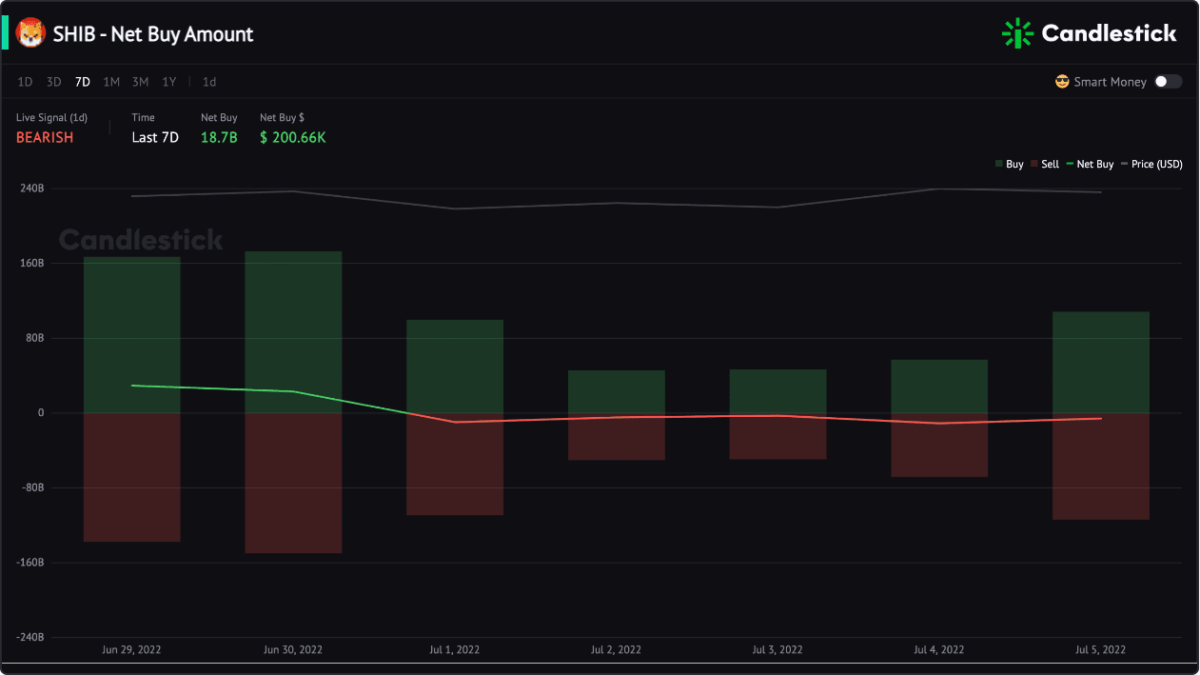
Looking in the long-term, it is not time to say positive yet. The SHIB Net Buy Amount continues to remain negative in the past 5 days.
SAND - Above The Avg HODL Price
SAND skyrocketed 10% last 24h. The current SAND price is above the traders’ Average HODL Price of $1.16.
The Avg HODL Price is an exclusive token indicator developed by Candlestick. When the current price is above the Avg HODL Price, it indicates profitable holders are increasing. They can sell to take the profit if they want.
Hence when the current price approached the Avg HODL Price, the token will meet some selling pressure.
When the SAND price was up above the Avg HODL Price on Jun 25, it drops back to below the Avg HODL Price.
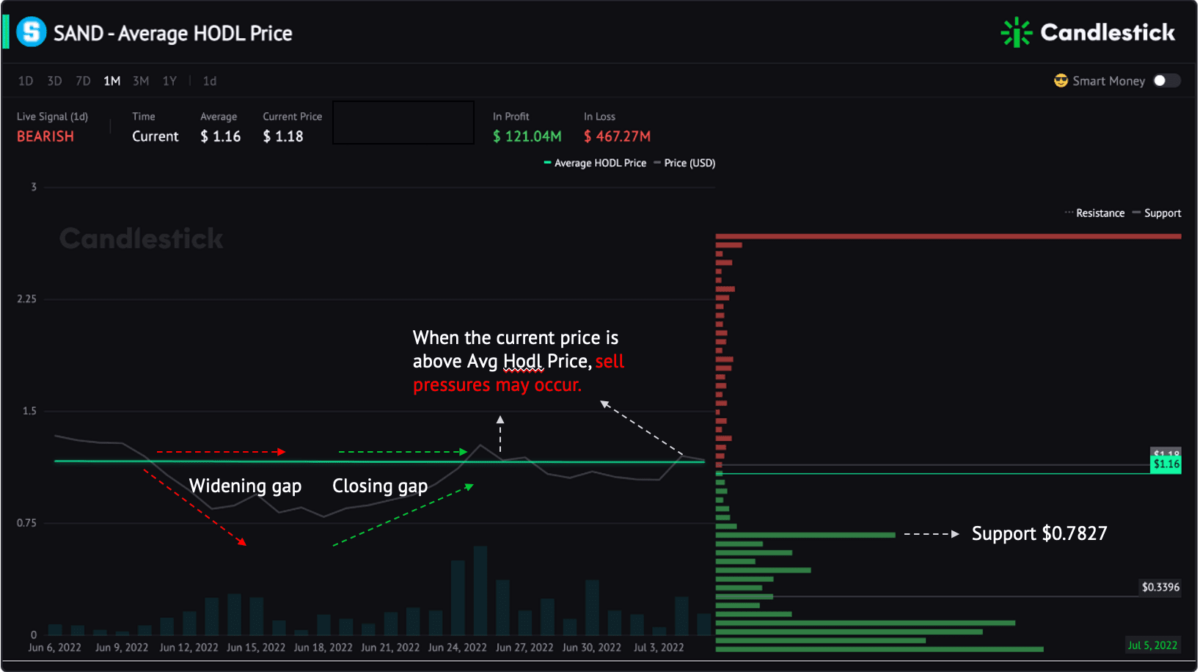
The “widening gap” and “closing gap” indicates the price bottom.
👉 3 Tips to Use The Average HODL Price Indicator
The special offer for early supporters ends in 8 days - Save $110