
Hey folks. I've been researching the charts and wondering if the Bitcoin bottom is near, and the answer is subjective, but in my opinion, I believe I have a good thesis to if the Bottom is near for Bitcoin.
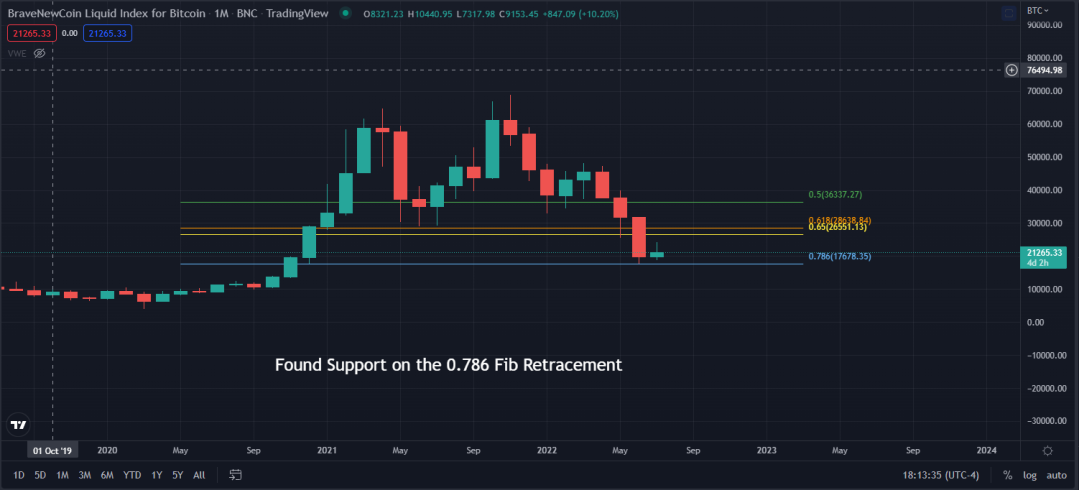
I would like to start with The BLX Bitcoin Chart. On the chart below notice as of now, Bitcoin has found support on the 0.786 using the Fib Retracement tool, near last Bull Run All Time Highs. But from this chart alone it is impossible to determine anything, just a building block in my question if the bottom is near.
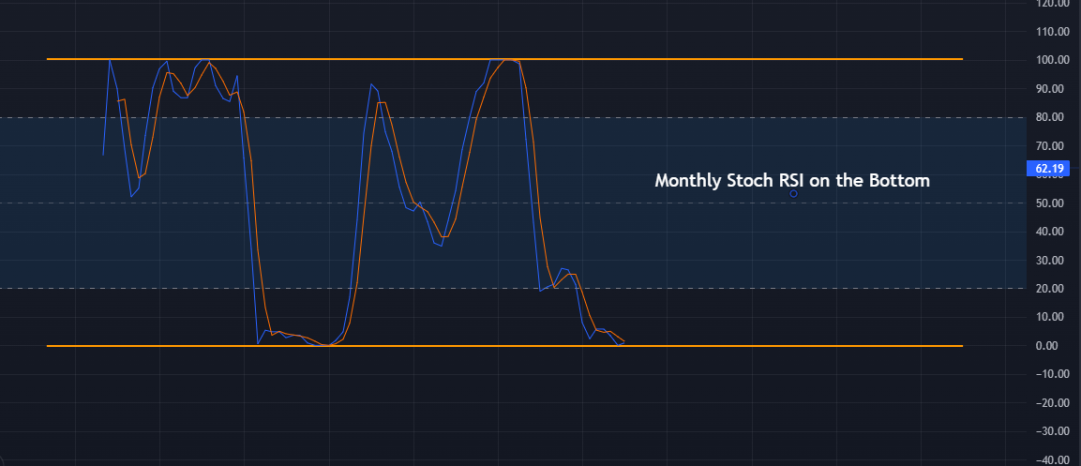
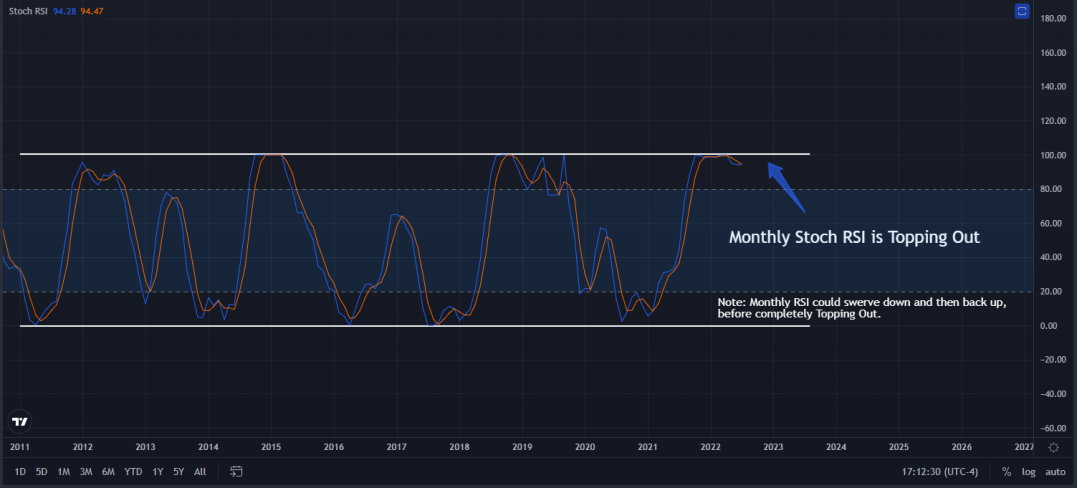
Next take a look at the chart below. It is the Monthly Stoch RSI Chart. Notice we are bottoming out, telling the us the price is oversold. Be warned, the Stoch RSI can bottom out for a long a time. Alone it can't predict anything, just another clue to the question. But what it can tell us, it is time to pay attention to the charts and start planning entries and developing strategies for the next Bull Run.
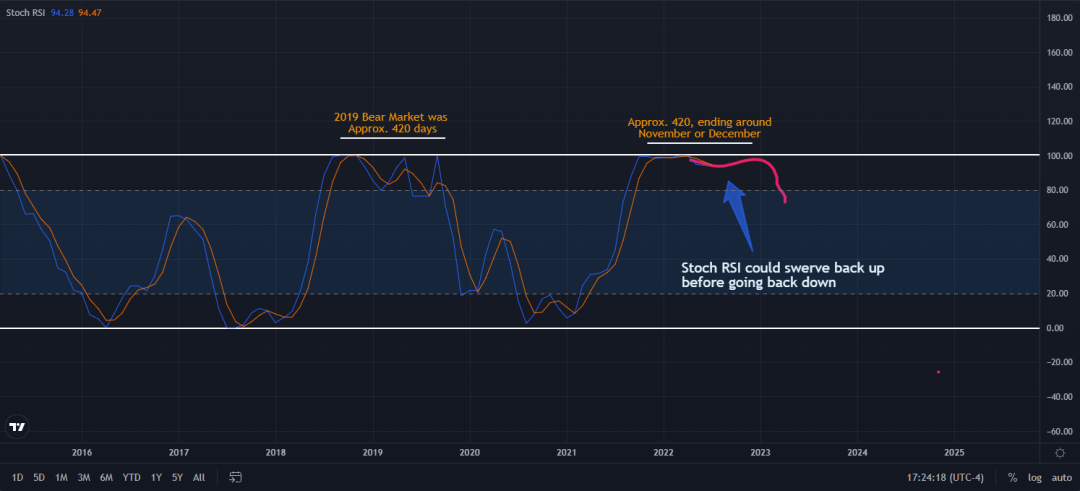
Now Lets take a look at the same chart, and break it down some more. Notice the last bear market was approximately 420 days, and if use the same time frame the bear market should end around November to December, but depending on where we line up the time frame it changes the approx. ending of the bear market. See chart 3.
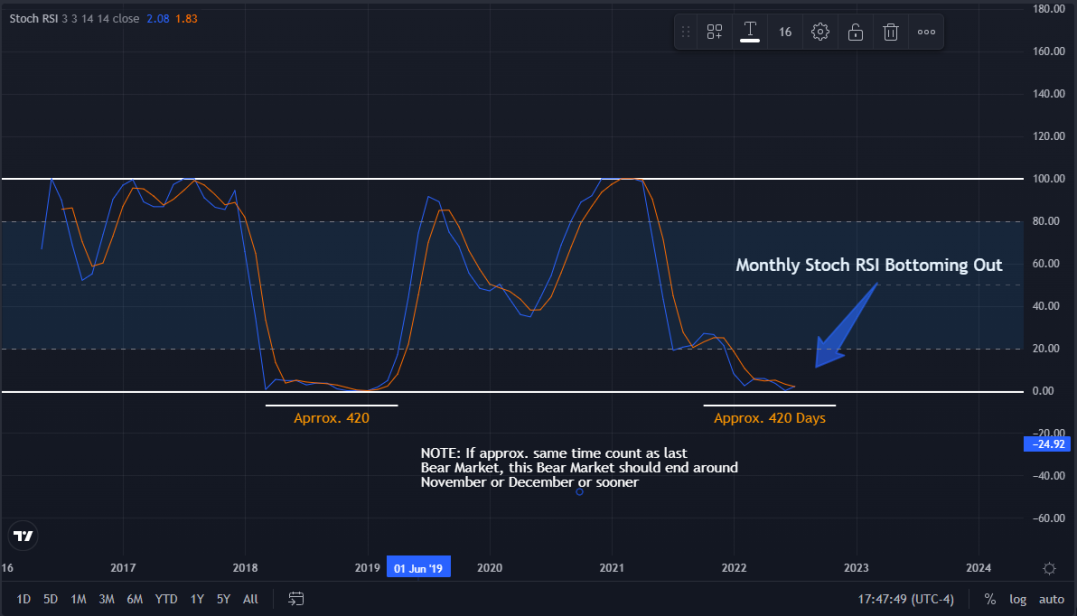
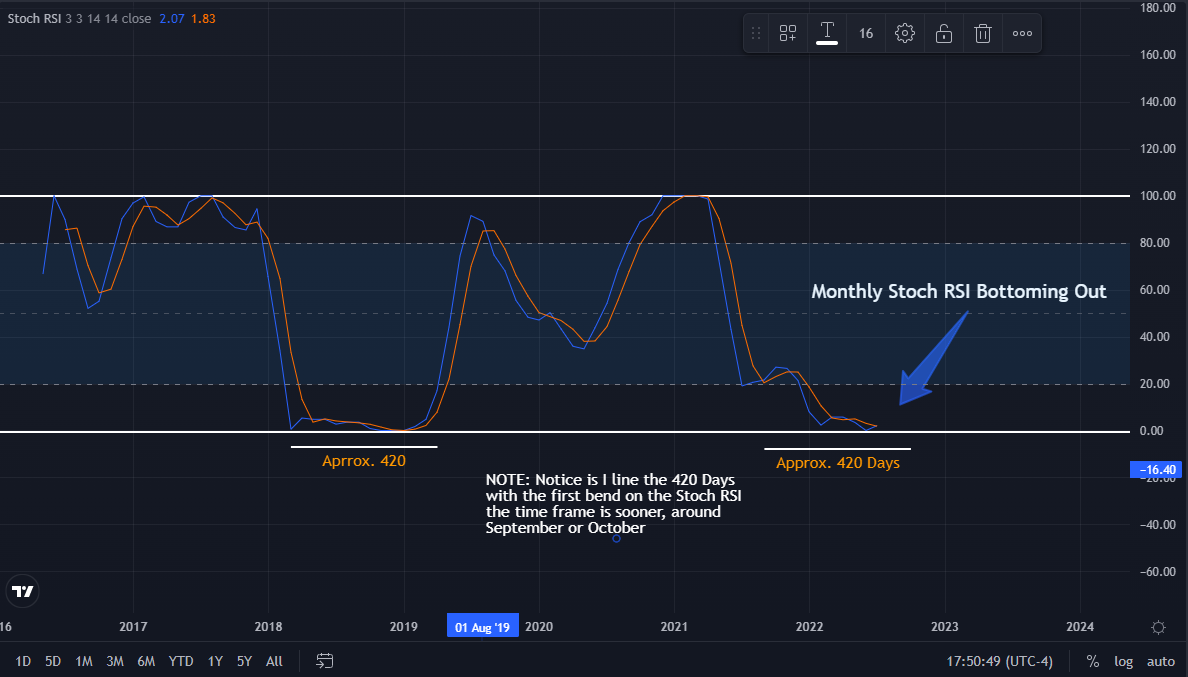
Chart3. Notice if line up the time frame with the first bend on the RSI it changes the time frame, ending around September or October.
On this Chart Bitcoin is retesting previous All Time Highs, which tells us, major supports are being tested.

Lets take a look at the RSI (Relative Strength Index) on the Monthly Chart, notice we are retesting 2019 lows, but also notice the Trend Line. One of Two could happen, either bounce from 2019 lows or continue down to the trend line before the major Bull Markets bounce.
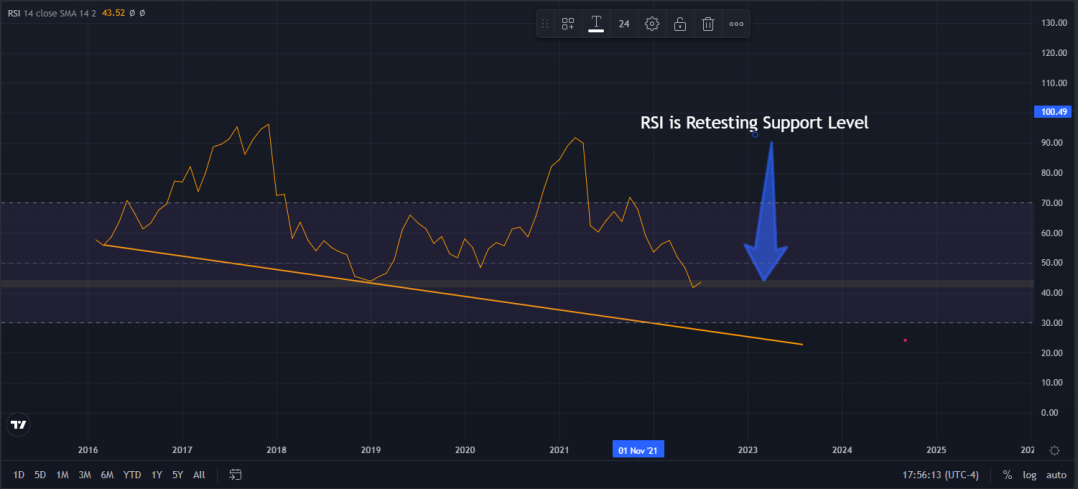
Possible move on Monthly RSI(Relative Strength Index). If this scenario plays out, it means we have more downside to go.

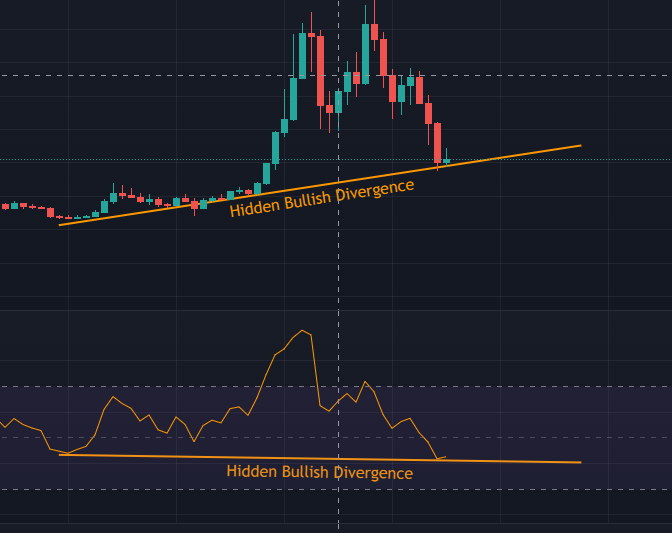
One good thing for the Monthly RSI (Relative Strength Index) his the Hidden Bullish Divergence, which means a continuation of the trend.
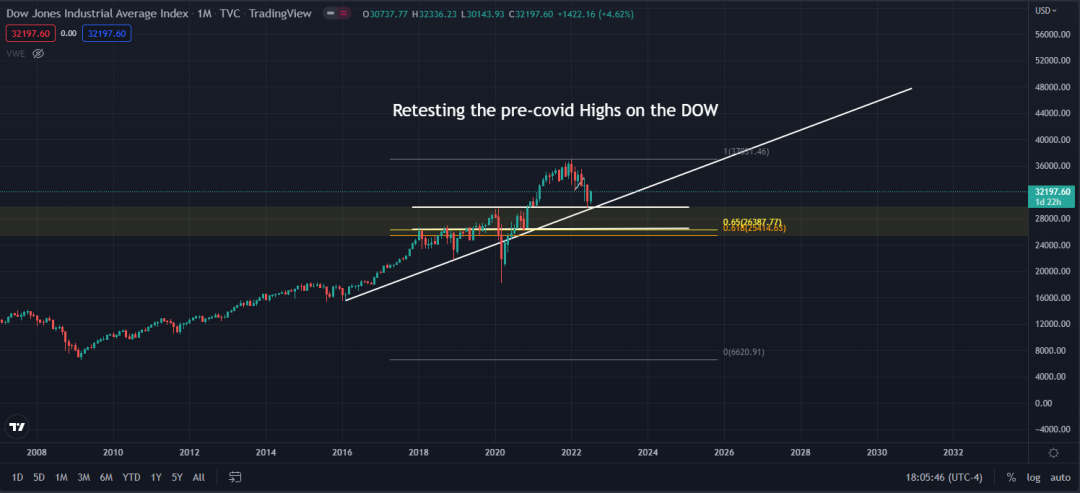
Now lets take a look at the Dow. Notice price action currently retesting Pre-Covid Highs, and notice the Golden Pocket on the Fib Retracement Tool. It is possible we could test the golden pocket, which lines up with strong support.
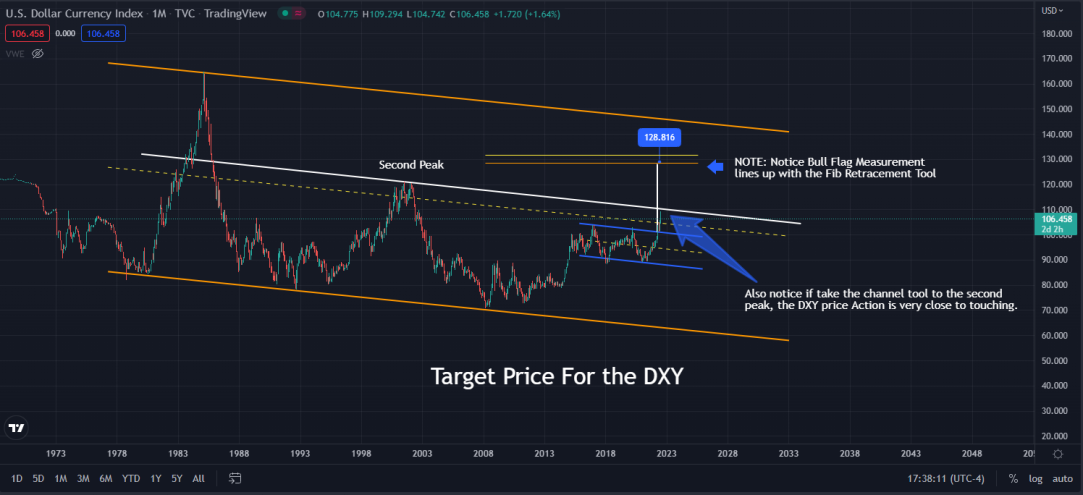
Lets take a look at the DXY. It has been on rip up lately. If measure the Bull Flag that it broke out from, the target price is 128.816 which falls right into the Golden Pocket of the Fib Retracement Tool. But take notice, if take the Channel Tool from the bottom to the top of the 2nd Peak. Price Action is very Close to the Channel Line. the question is, will price action reject or break through?
The Monthly Stoch RSI is Topping out, which means the DXY is over bought.
Now the chart below is a possible price action and outcome. If take the approx. 420 days of the last Bull Market for the DXY and apply to this Bull Market for the DXY, we get an ending around tail end of the year.
Final Thoughts
If take all the evidence, we get a mixed answered to the question, Is The Bottom Near for Bitcoin? If we take the charts above and the over all sentiment of the market, all evidence indicate the bottom is near. When I say bottom, I'm referring more to when the Bear Market will end, and not necessarily price action. Far as price action, we could have bottomed already and trade sideways for a next several months, or we could dip lower. So, In my opinion the bottom is near, just not now. To me the charts indicate the bottom will be around tail end of the year or first quarter of next year.


