
The price of Bitcoin (BTC) is facing a crucial phase in the wake of the geopolitical tensions shaking the world, especially the escalating conflict between Israel and Iran. The BTC price shows resistance above $100,000 after the United States bombed three Iranian nuclear facilities (Fordow, Isfahan and Natanz).
Amid this uncertain environment, market analyst Willy Woo warns that “BTC has undergone a structural shift.” For this reason, he recommends: “Remember that real value doesn't come from price predictions, but from seeing the full structural picture so you can make your own decision about the best path to take to manage your capital according to your goals.”
To support his argument, the analyst shares a chart from Swissblock Technologies, a firm specializing in digital asset market analysis, which shows the structural shift Willy Woo mentions. This is a mismatch between two key metrics, such as network growth and the decline in liquidity, which alter Bitcoin's behavior.
The thing is, when the network grows, that supports a price increase. But currently, even though there's growth in the network, liquidity is falling, which generates the structural imbalance Woo refers to. As seen in the following graph, the yellow line represents the BTC price, while the lower part highlights the network's growth in terms of transactions (red line) and on-chain liquidity (blue line), i.e., the capital moving within that environment.
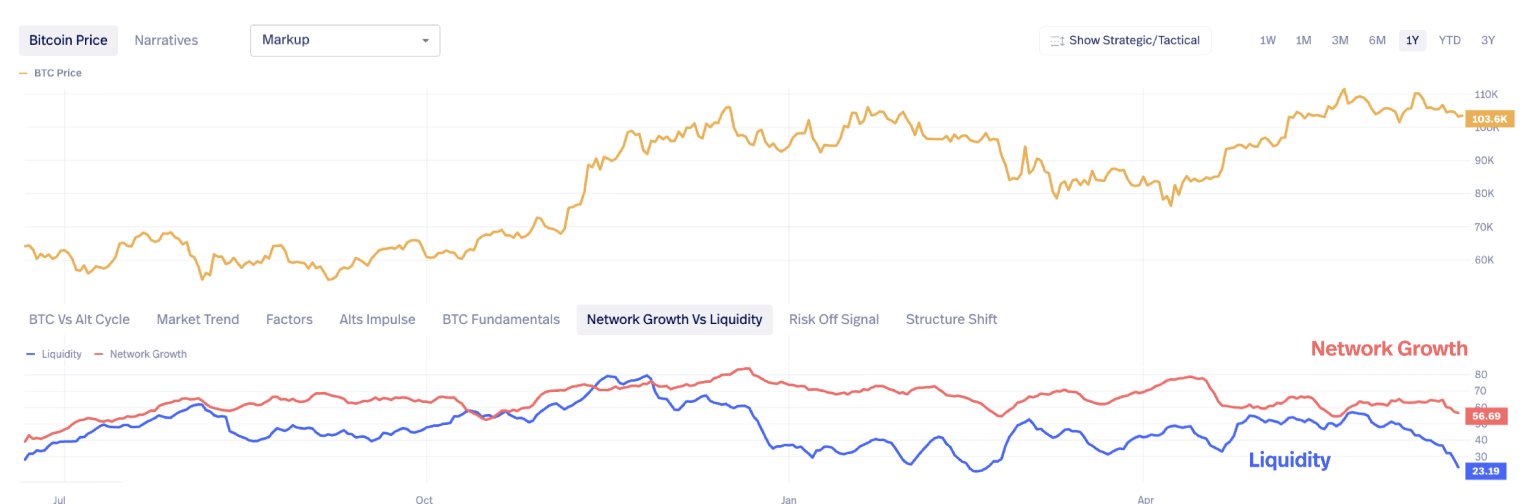 There's a gap between network growth and BTC's on-chain liquidity. Source: Swissblock -x.
Regarding this, analysts at Swissblock Technologies say: “This rapid drop in liquidity in itself is a concern and shows a reduction in overall system activity. Greater liquidity correlates the price more with on-chain dynamics versus external factors. Lower activity makes the price more susceptible to downward volatility.” In simpler terms, and in response to the question posed in the article's title, a surge in on-chain liquidity on the Bitcoin network will be key for the price to rise. This is because high on-chain liquidity means more transactions, greater demand, and a better market capacity to absorb purchases or sales without causing sudden price movements.
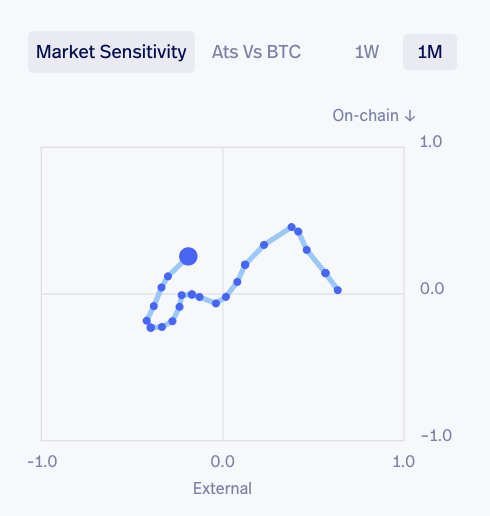
An uptick in liquidity suggests real investor interest and sufficient capital to sustain a solid price rally. In line with this diagnosis, the Market Sensitivity chart reinforces the idea that BTC's price behavior is currently more influenced by internal factors than by global events. This indicator measures how much market movements depend on two types of forces: external factors (such as interest rates, regulations, or geopolitical conflicts) and on-chain factors (such as network transactions or active wallets).
In the chart, the horizontal axis shows sensitivity to external factors over the past 30 days, while the vertical axis reflects the weight of on-chain factors . Each blue dot represents a measurement over time, and the larger circle indicates the current position.
 Market sensitivity. Source: Swissblock.
As can be seen, the line is shifted towards the upper quadrant, indicating a greater dependence on on-chain activity and a lower response to external events. This pattern coincides with a low-liquidity environment, in which price action becomes more vulnerable to any fluctuations within the network. In this context, a sustained increase in liquidity would not only reflect a return of investor interest, but would also provide the market with the strength necessary to sustain a price rally.
Otherwise, if liquidity doesn't recover, BTC will be more exposed to widespread volatility. In this context, even good external news (such as a ceasefire in the Middle East) could have a limited effect if not accompanied by an internal recovery within the network. However, Swissblock specialists point out that “not all is lost” and emphasize: “Although we have had a sudden outflow of liquidity, the long-term bullish structure remains intact as long as our risk signal ( Risk off signal ) remains at 0.”
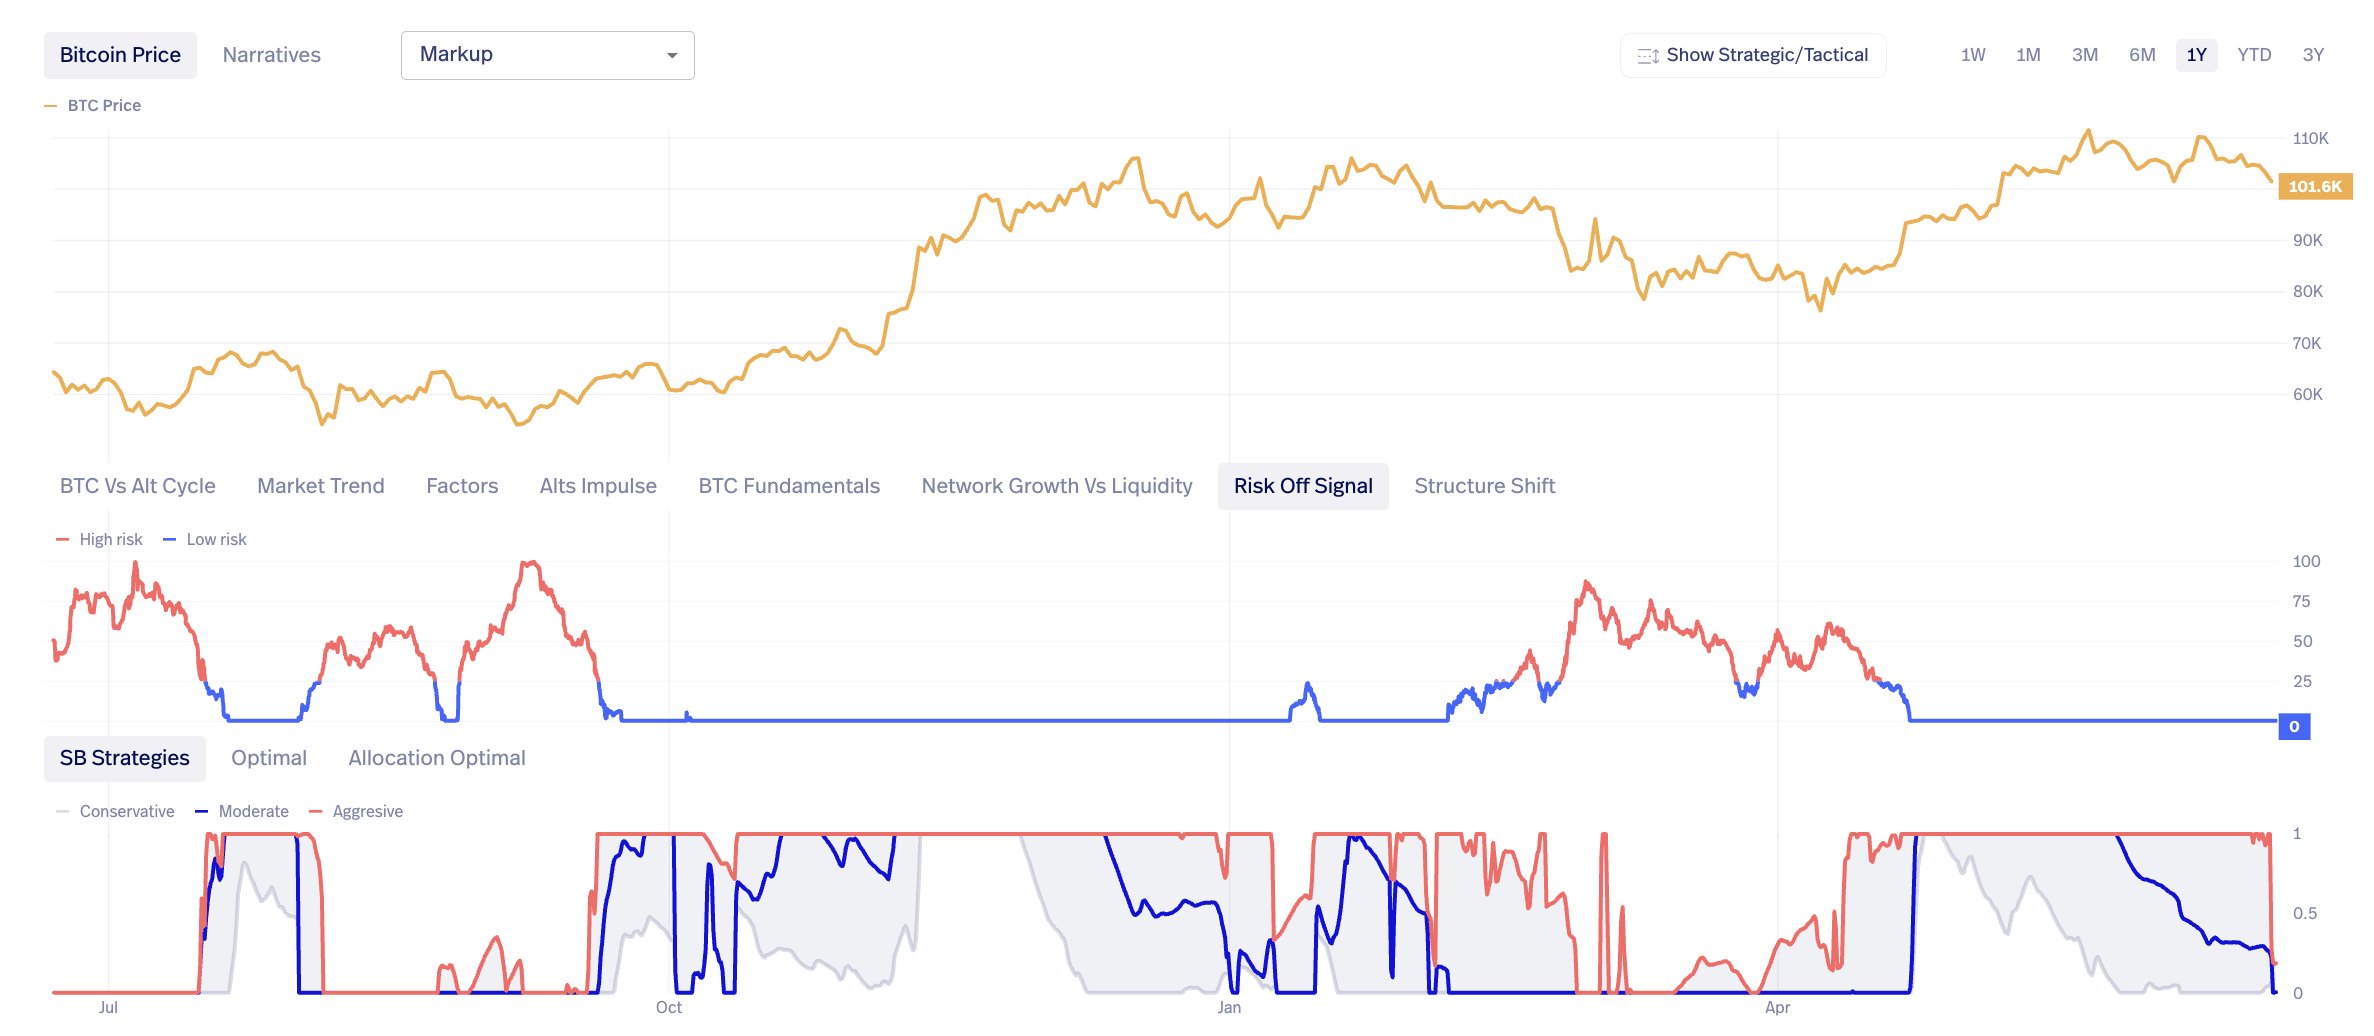 The Bitcoin risk indicator is at 0. Source: Swissblock -x.
They also add that while liquidity conditions have deteriorated, the broader bullish structure remains firm as long as risk signals remain low. In fact, Willy Woo himself believes that “although BTC has entered the final phase of its bull market,” he doesn't rule out the possibility that the BTC could reach a new all-time high (ATH) in the short term. His projection is that the BTC price will quickly climb to $118,000 if it surpasses $112,000.


