
Bitcoin's (BTC) recent decline, which has accumulated 12% since its previous all-time high of $124,000, has clearly generated concern in the market. However, to calm investors, certain data suggests that this movement is completely normal during bullish cycles.
In the current Bitcoin cycle, which began with the March 2024 peak, the largest drop reached 28%, and on average, the most severe corrections have been between 20% and 25%. Therefore, the current magnitude does not break historical trends.
According to CryptoQuant community analyst "Darkfos," these phases typically have a functional effect on bull markets. He explained:
"This current move is not unusual and could continue without breaking the historical pattern. In fact, such pullbacks are typically healthy in bull markets, as they serve to reset excessive leverage in derivatives, cool overheated sentiment, and provide new entry opportunities for long-term investors."
Darkfos, financial analyst.
The following chart shared by Darkfos shows that BTC's most significant pullbacks during the current cycle average 20%.
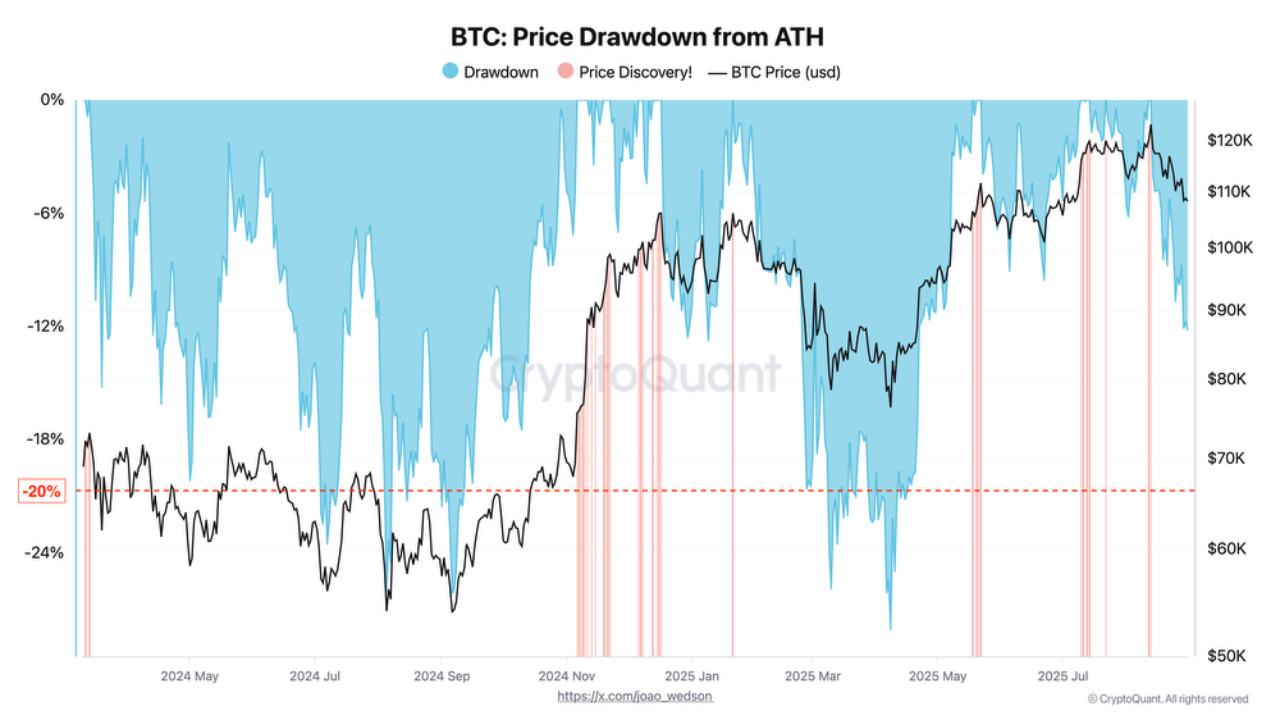 The average BTC drop during this cycle is 20%. Source: CryptoQuant.
Other voices agree
Darkfos' interpretation coincides with that of Carmelo Alemán, also an analyst in the CryptoQuant community, who believes that recent declines in BTC's price should be interpreted as an adjustment within the same cycle.
He points out that, despite the pullback, on-chain data "continues to show signs of accumulation by long-term holders, while BTC reserves on exchanges continue to decline." He explains that this suggests "moderate selling pressure" in the market.
Alemán noted that Bitcoin's bullish cycles have historically been accompanied by significant corrections before reaching new highs.
Among the indicators analyzed, NVT stands out, a metric that compares market capitalization with network transaction volume. When NVT remains low, it implies that Bitcoin may be undervalued relative to actual activity. In this sense, since July 7, the indicator has been below 50, a level historically linked to signs of growth. This chart shows this better:
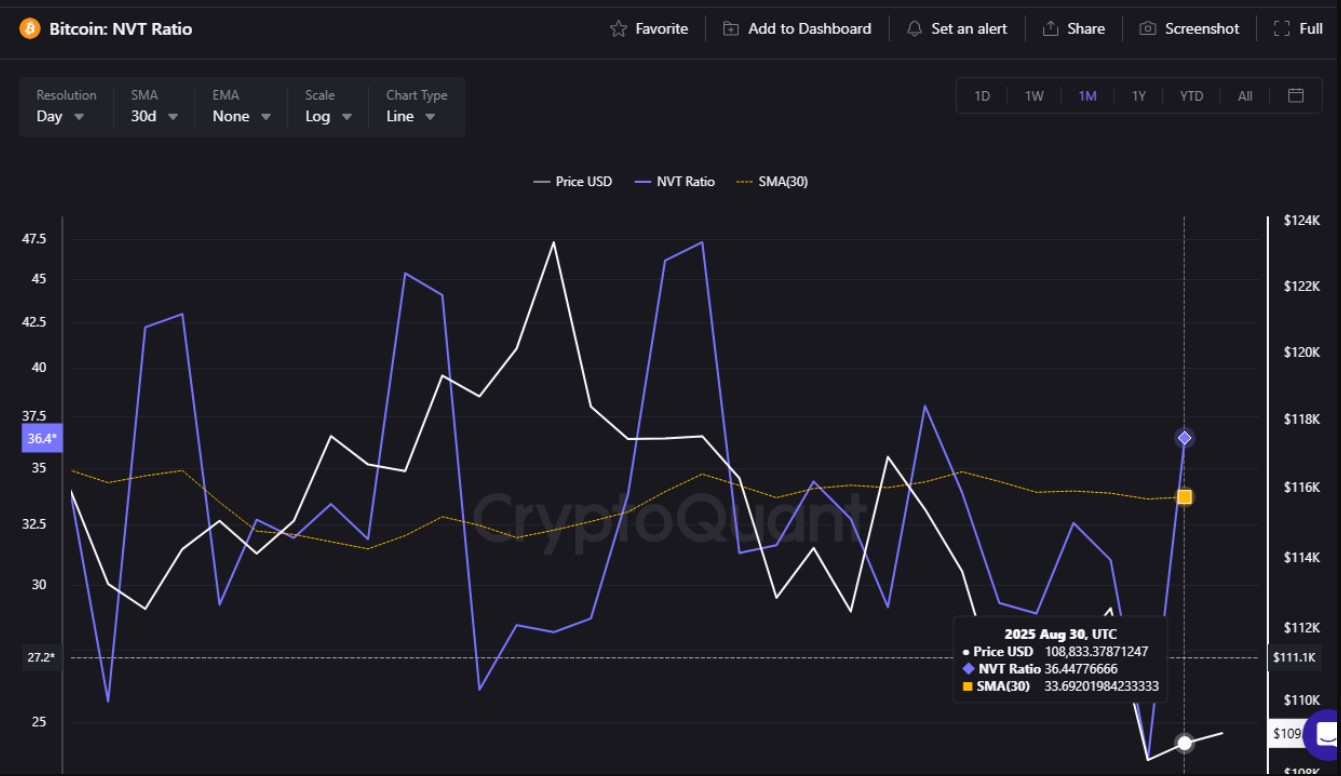 This level suggests that there are signs of growth in the offing. Source: CryptoQuant.
The analyst also reviewed the MVRV, which measures the relationship between market value and realized value. Despite previous price increases, this index has not yet approached the critical level of 3.6, which in previous cycles coincided with all-time highs and peaks, indicating that a euphoric phase has not yet been reached.
This behavior among miners is also observed as a relevant variable. Alemán explained that Bitcoin miners' reserves remain stable at 1.8 million BTC, with a reduction of just 6,000 bitcoins so far in 2025. In previous cycles, miners tended to sell more aggressively at peak times, but the absence of that trend reinforces the idea that there is room for a new bullish phase.
This graph shows how Bitcoin miners have performed over the years:
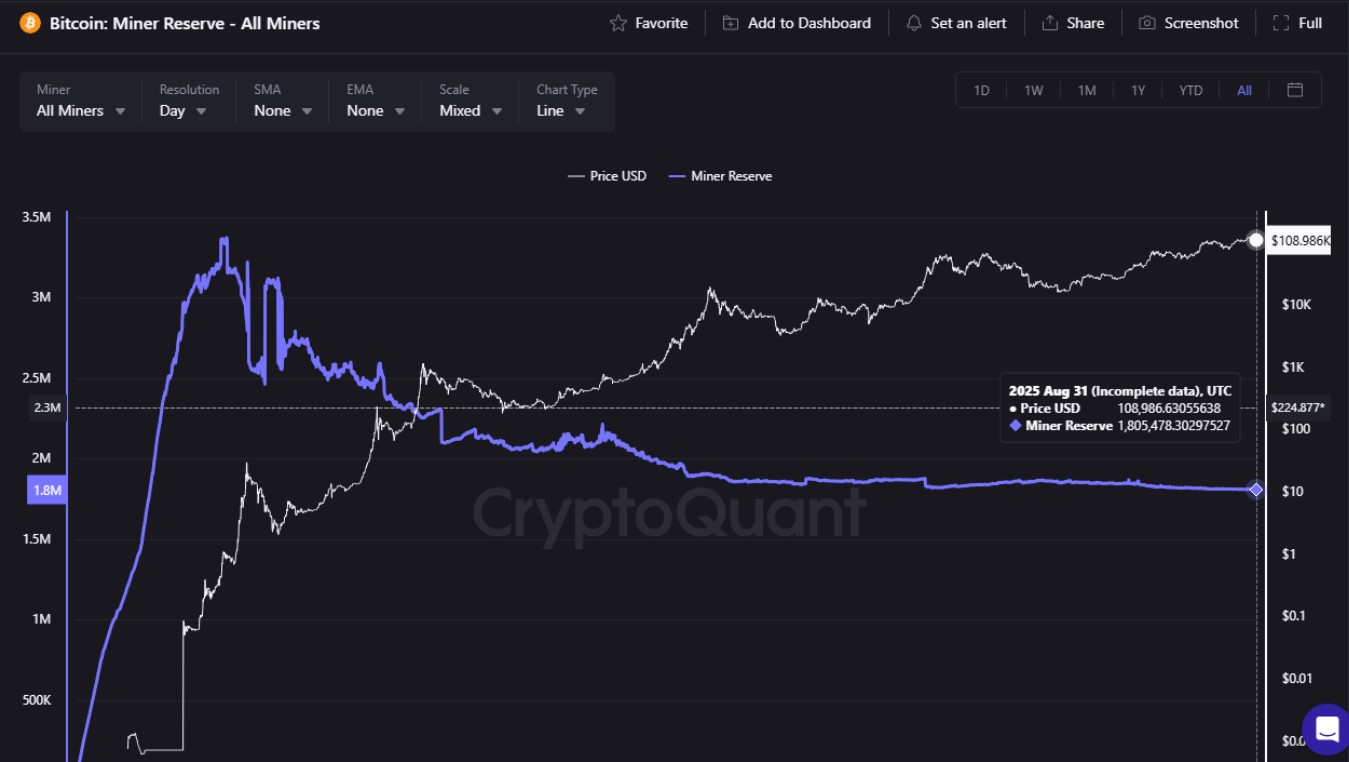 Miners haven't exited their holdings en masse this cycle. Source: CryptoQuant.
Another benchmark is the aSOPR, a metric that measures the profitability of coins moved on the network. When this ratio remains above 1.00 for extended periods, it indicates that most movements are profitable, which in sustained phases has coincided with market peaks.
Alemán emphasized that, while the indicator remains positive, at levels of 1.00, it has not reached levels that define a stage of overvaluation. Taken together, these metrics show that Bitcoin is undergoing a correction, but with a context still favorable for a possible rebound if demand holds.
Divergent visions
In addition to these readings, other analysts maintain positive expectations for BTC. Digital markets specialist Oriental Trader maintains that there are grounds for optimism. These include increasing liquidity in global markets, the expectation that the US Federal Reserve may implement interest rate cuts, and Bitcoin's ability to offer returns superior to those of traditional assets. In his view, these factors support an environment that could reinforce the accumulation narrative and maintain the interest of institutional and retail investors.
However, not all readings are converging. The analytics firm Glassnode believes the Bitcoin market remains significantly fragile. In its most recent report, it highlighted that "the market structure remains fragile, with downward pressures dominating spot, futures, and on-chain metrics." It also noted that inflows into US-traded Bitcoin ETFs served as a temporary cushion, but the contraction in volumes and weakening profitability reflect a lack of conviction.
According to this analysis, the possibility of short-term rebounds exists, although the overall sentiment remains defensive, with risks skewed toward further consolidation if stronger demand does not emerge.
The divergence of positions reflects the current state of the market, where signs of bullish continuity coexist with warnings about structural vulnerabilities. For proponents of the accumulation thesis, on-chain metrics and macroeconomic fundamentals support the argument that BTC has not yet reached a ceiling in this cycle. More cautious viewers, however, emphasize the decline in buying momentum and signs of weakness in activity indicators.
It's abundantly clear that Bitcoin is undergoing a correction that, based on historical data and network metrics, remains within the parameters of a bullish cycle. Therefore, the evolution of demand indicators, miner activity, and the flow into instruments such as ETFs will be key factors in helping determine whether BTC's performance is a prelude to a new surge or the start of a prolonged period of consolidation.






