
Ethereum is consolidating its position as a leading player after a rally that has captured the attention of investors and analysts. Since its lows of $2,174 on June 21, the cryptocurrency has rallied nearly 50%, defying expectations and marking a turning point in the ETH/BTC ratio.
This move, supported by an influx of capital migrating away from Bitcoin, suggests that the altcoin market may be entering a new phase.
 Technical analysis of Ethereum price. Source: Market Pulse.
The ETH/BTC ratio, a critical indicator for gauging altcoin appetite, broke above the 2.64% ceiling yesterday.
This level, which had held back altcoins since the start of the Israel-Iran war, signals a shift in demand, according to analyst Elior Manier.
“The ratio has just broken out of its range,” Manier stated, highlighting Ether’s upside potential. Projected targets for this ratio range between 2.90% and 3.1%, which could boost ETH if Bitcoin stabilizes at its current levels.
A market in transition
The flow of capital from bitcoin to ether marks the beginning of phase 2 of the rotation cycle. Historically, this phase precedes an "altseason," where altcoins gain ground after Bitcoin stabilizes. Since October 2024, when BTC began its climb toward $100,000, Bitcoin's dominance in market capitalization has been overwhelming.
However, the recent rotation suggests that investors are seeking higher returns in ETH, the most valuable digital asset on the market after bitcoin.
Technical levels in the spotlight
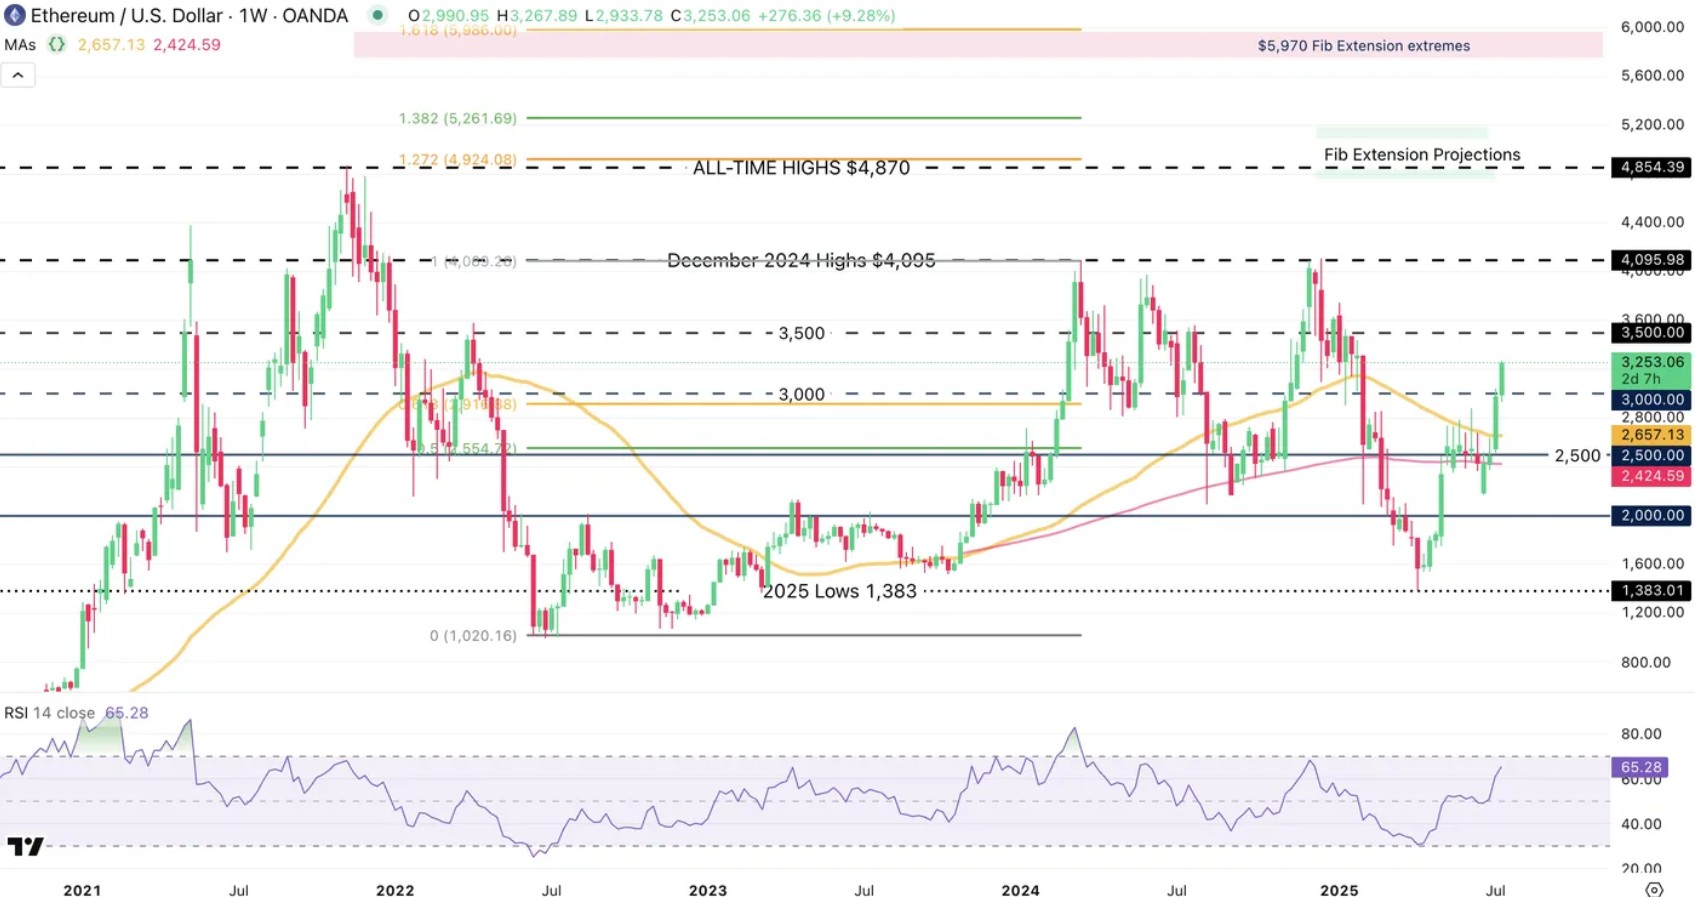
On the weekly timeframe, ether has traded within a three-year range, but Bitcoin's recent rally and growing cryptocurrency adoption open the door to new highs, Manier explains.
Fibonacci extensions, a tool that projects price levels based on mathematical ratios, indicate that a break of the December 2024 high could take ETH to levels between $4,915 and $5,250 (127.8% to 138.2% Fibonacci), with a more ambitious target of $5,970 (161.8%).
 Technical analysis of Ethereum price. Source: Market Pulse.
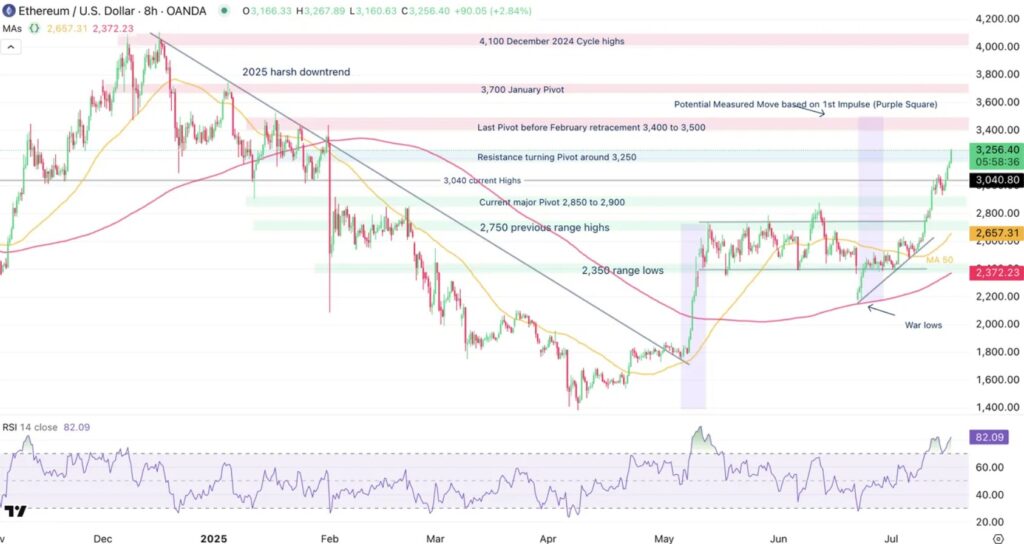
Despite the enthusiasm, the Relative Strength Index (RSI), which measures the speed and magnitude of price movements, shows that ether is at overbought levels. This could trigger a correction, although Manier warns: "The upward movement may continue before stalling."
Buyers now face key resistance at $3,250, which must consolidate as support to maintain momentum.
However, Manier emphasizes the unpredictability of the market, as anything can happen; markets are volatile, and he only points to probable scenarios.
Supply crisis on the horizon
An additional factor is driving the bullish narrative. The Wintermute trading platform's OTC (over-the-counter) desk has run out of ETH, pointing to a supply crunch. This phenomenon, driven by large buyers and institutions, usually precedes sharp upward movements in price.
For its part, investment firm EMJ Capital projects an even brighter future. According to its model, the SEC's approval of Ethereum ETF staking, expected before October, could transform ETH into a passive income asset. This would boost its adoption in the traditional financial system, with price projections reaching $10,000 in the base case and up to $15,000 in an optimistic context.
Despite the bullish signs, the road ahead will not be free of volatility. The combination of technical indicators, capital turnover, and regulatory developments positions Ether at a pivotal moment. While investors watch closely, the market is preparing for what could be a new era for altcoins.






