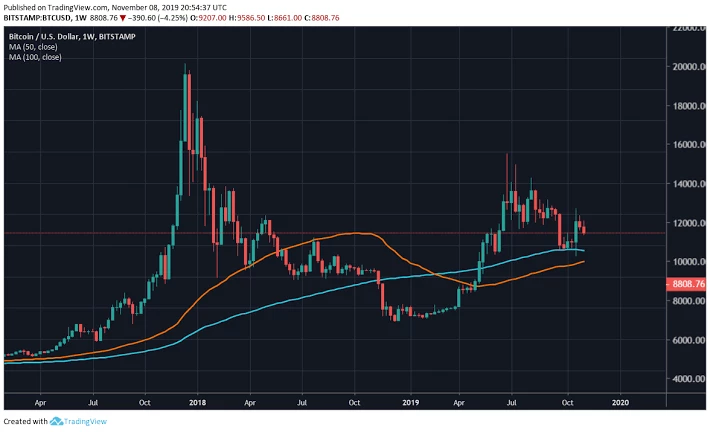
The leading crypto currency is gradually getting closer, with the 50 and 100 week moving averages on the Bitcoins weekly chart. If an intersection occurs, this will be the first in 3.5 years.
Bitcoin's 50-week moving average and the 100-week moving average are gradually approaching each other. This shows that there is a potential kr golden cross ”on the weekly chart of the largest crypto currency.
If the two moving averages intersect in the coming weeks, this formation will be seen in the largest crypto currency for the first time in 3.5 years.
Golden cross is a technical chart model that signals that the price may be preparing for a big rally.
Such an intersection was last seen in May 2016, and Bitcoin increased from $ 438 to $ 20,000 by December 2017. According to CoinDesk analyst Sebastian Sinclair, the intersection will be in late December or early 2020, if the moving averages continue to converge as they are now.