This article is a technical take on Bitcoin for late September re-pricin
Long Position in Bitcoin at 19,100
I use a lot of visuals to describe opportunities in trades so we will include several images to make the case for bitcoin
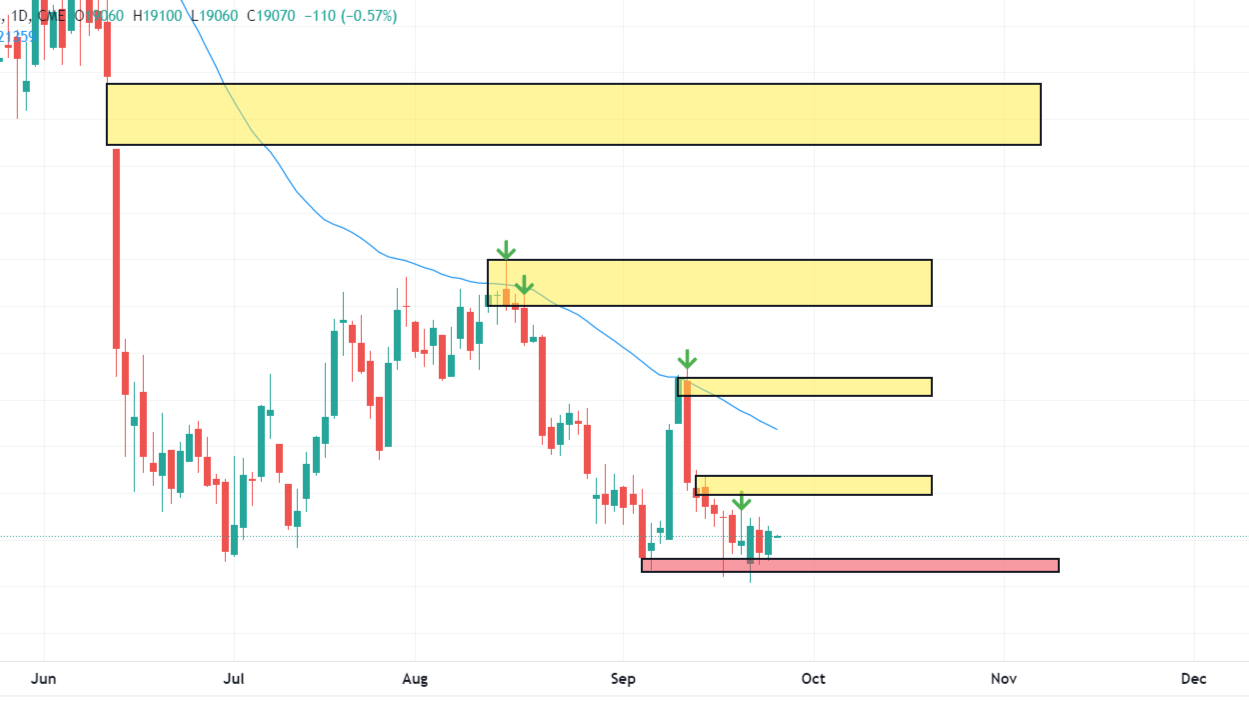
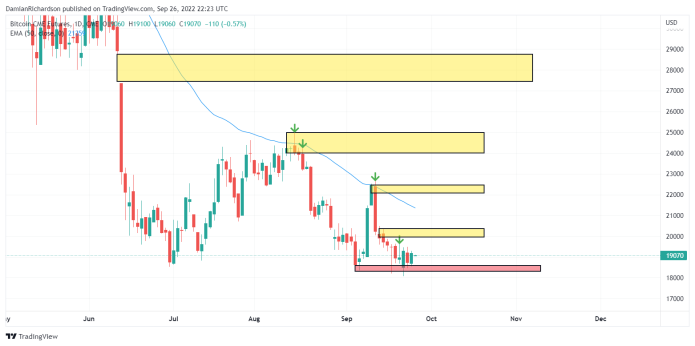
Here are some themes for this week as stocks have been going down and Bitcoin is in a buy zone so it seems. We are starting with a daily chart to begin the process of holding BTC for a good portion of this week
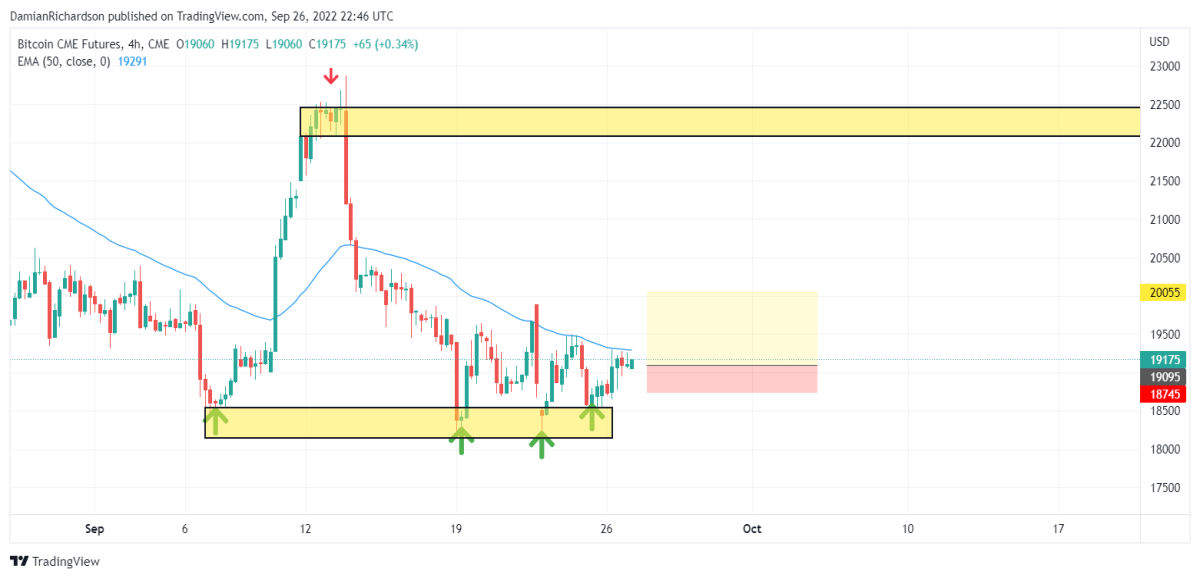
This chart depicts Bitcoins obstacles in yellow, and a possible supportive zone in red
Here are some reasons why there should be some bullish action in BTC and rationale for a trade
- The Relationship between Price and Moving Average - the tendency to catch up
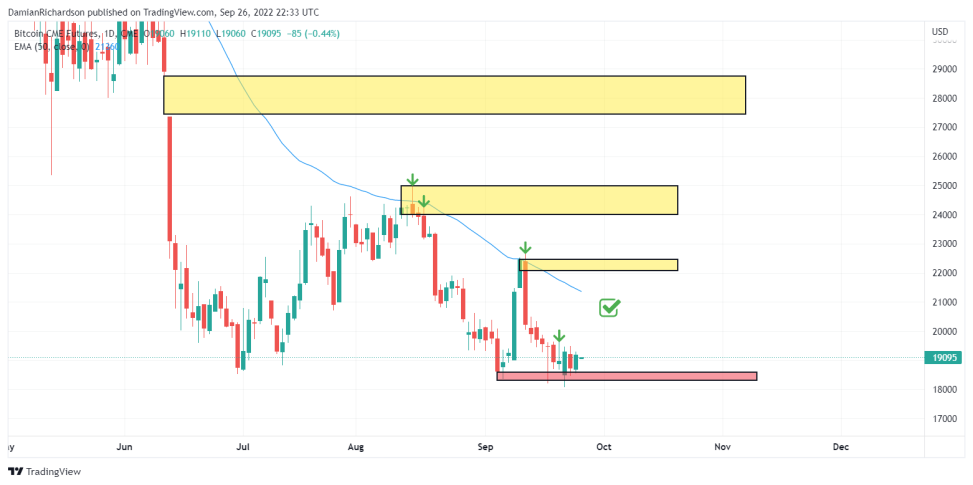
This daily chart shows a check mark that estimates the location of where price can touch its moving average which is hovering above 21,000
The technical analysis principle behind this situation is that price will eventually touch or make contact with its moving average as assets tend to revert back to their mean. The average price for Bitcoin is being re-evaluated and it likely will stay around 20,000 to 21,000 after reconnecting with the 50-EMA (exponential moving average) colored in blue.
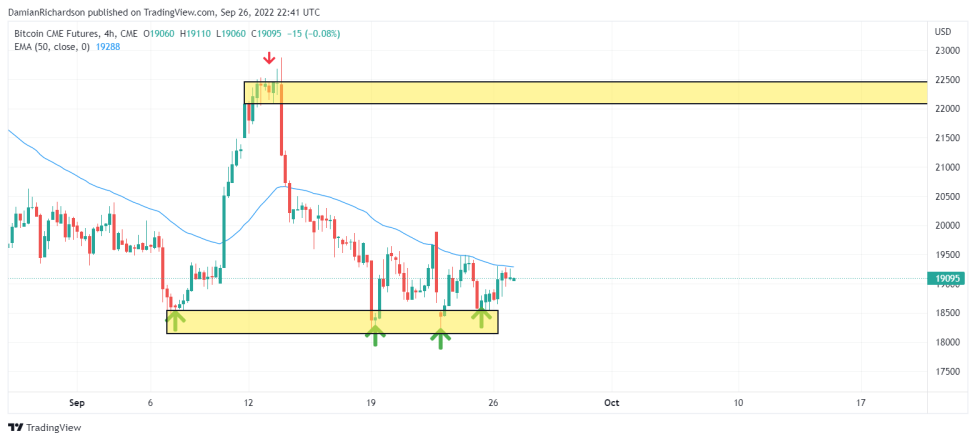
- The Deep Demand at 19,000
This chart shows where the buyers have stepped in. Now that 18,000 has been so well defended they have some degree of clearance to lift it beyond 19,000 as they become more confident
- Overhead Yellow zones on the daily chart
The nature of the trade itself: The long position in Bitcoin presents itself with 300 in risk with 900 in reward - a 3 to 1 ratio
If the buy the dip mentality has really stopped working we would know that to be the truth if price continues falling below 18,500 or worse.