
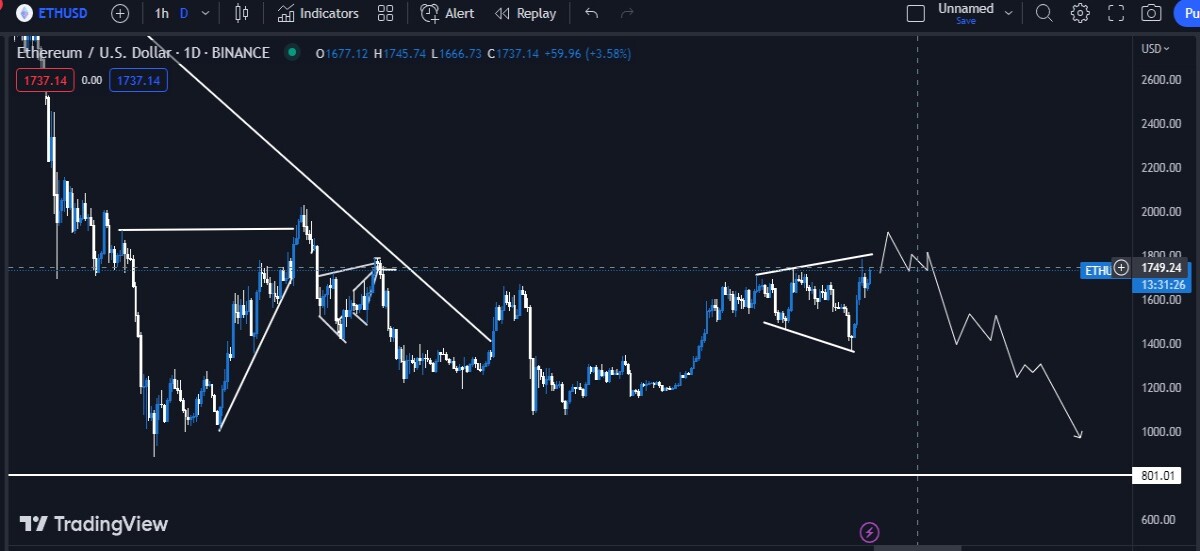
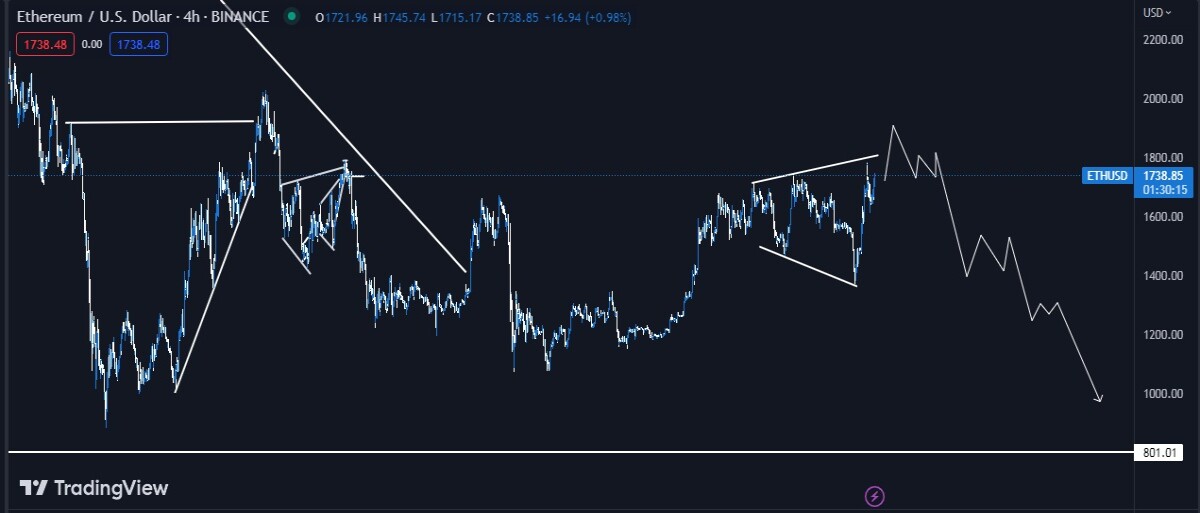
By looking at the chart we can see that Ethereum is showing price action that is similar to that o Bitcoin. When Bitcoin goes up Ethereum tends to do the same and also to the downside.
Similar to the bitcoin chart, ethereum is also creating a larger 3 touch flag structure and the price is currentl going or the third touch of the strucutre and according to my analysis we can expect a bigger reversal of the market.We have to wait and watch how the price reacts on the contact point before making any move.
Most likely price will have a impulse move to the contact point as its usual to have impulse moves on last leg of a structure and will come back inside the structure and will continue to the downside.
This is for educational purposes only.
Thanks for checking out my post.


