
In part 1 of this series I promised to make a very short post on another meaning of the word RISK.
If you have been for a time, you may have heard the word risk used in phrases like 'RISK / RETURN RATIO'. In this case, 'risk' does not mean anything that we think using this word everyday. It has a special meaning.
If we look into Investopedia (which I always recommend as a good source of definitions and concepts as explained for beginners), then we will find this:
Risk is defined in financial terms as the chance that an outcome or investment's actual gains will differ from an expected outcome or return.
and
Quantifiably, risk is usually assessed by considering historical behaviors and outcomes. In finance, standard deviation is a common metric associated with risk. Standard deviation provides a measure of the volatility of asset prices in comparison to their historical averages in a given time frame.
Well ... haven't I said Investopedia is a good place to look up basic definitions? Forget it. ;-)
I bet not everybody understood what they mean, so I will try to explain the concept in even simpler (even if not 100% correct) terms.
Look:
Imagine that BTC is having a good year, and its price goes about 1% up every day. There are no ups and downs, just a steady daily price growth of roughly 1% per day. Just like a bamboo sprout. And so, over one hundred days, BTC price goes from 10k to let's say 27k. YES?
OK. So, in the above case, the expected return on BTC is 270%. And because the price went always up and always by the same amount, the risk is ZERO.
But look again:
Imagine that BTC is having a good year, and its price ON AVERAGE goes about 1% up every day. HOWEVER, this time it goes up and down in ups and downs (the typical zig-zag of daily prices ...). And so, over one hundred days, BTC price goes from 10k to let's say 27k. YES? Because on average it still went 1% each day ...
OK. So in the second case case, the expected return is ... again 270%. And because the price went up and down in ups and downs - we run the risk that if we buy one day and sell another we may get a loss. But if we buy again and sell on another day, we may get way more than 1% (average daily) gain - maybe 2%, or maybe 3%.
A-ha. Then if a price looks like a straight line (going up, horizontal or down, but going straight!) we have no risk - we have only expected change of the price. But when prices change in a zig-zag manner, we may still arrive at the same price in our 100 days' period BUT we will have a more risky business to manage.
The zig-zaging action of the price is called VOLATILITY (see my earlier posts) and the wilder the zig-zags, the more volatility, the more RISK.
How to calculate this kind of risk? You can use standard deviation, as explained in links below this text.
Why to calculate it? To compare various assets and learn which are better choices than others.
Which are the better choices then? Well, this depends on how much you like risk!
Last thing, but one that you may want to try out: draw a plain graph with one axis to measure risk and the other axis to measure return. Now place both versions of BTC on it. What do you see?
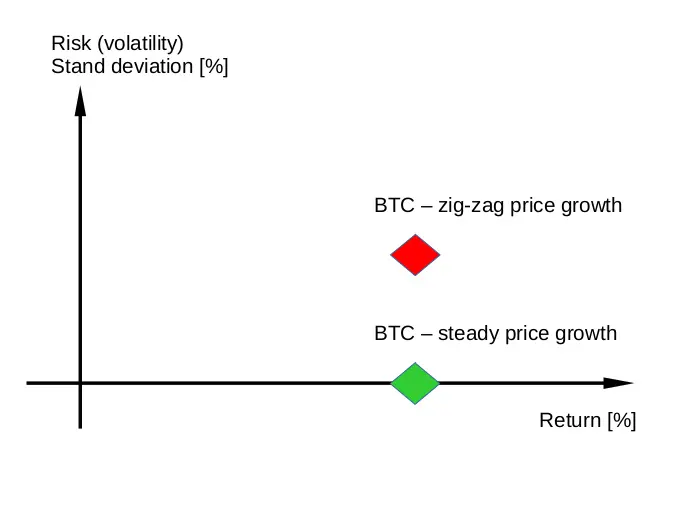
Well, both have the same expected RETURN but the one gaining price in zig-zag action is more RISKY. The wilder the zig-zag, the more risk.
You can graph BTC vs. ETH and vs. all other 'coins' and 'tokens' like this. And then (with just some more education) you can select the ones that have BETTER return to risk ratio. You can then reject the ones that offer the same amount of return but are more risky.
PS I have made some very radical shortcuts, so the above is NOT 100% correct (from the financial / mathematical point of view) BUT I did it all for your good, so that you can grasp the idea. You can find exact formulas and method described in the links below my text.






