
The cryptocurrency market is currently traversing a highly fascinating phase where macroeconomic forces are taking center stage. Recent data from the united states department of Labor revealed that weekly jobless claims dropped unexpectedly to 208,000, coming in significantly lower than the projected market consensus of 216,000. When combined with core retail sales growing at a steady monthly pace of 0,7%, the broader picture indicates that the US economic engine is still running incredibly hot. This strong economic performance immediately boosted the US dollar index toward the 100.57 mark. Consequently, this surge in dollar strength has applied noticeable short term pressure on major digital assets like bitcoin, forcing the market into a crucial consolidation phase as bulls fight to maintain their macro structure.
Despite the macro headwinds and bitcoin hovering around the $63,000 to $64,000 range, derivative market behavior reveals a very resilient trader psychology. The latest open interest and volume data shows that market participants are refusing to back down, with open Interest holding strong around the massive $110 billion mark. This tells us that leverage traders are not panic closing their contracts, but are instead actively defending their positions. We also saw a brief trading volume expansion during the middle of the week, showing how quickly capital reacts to the changing global narrative.
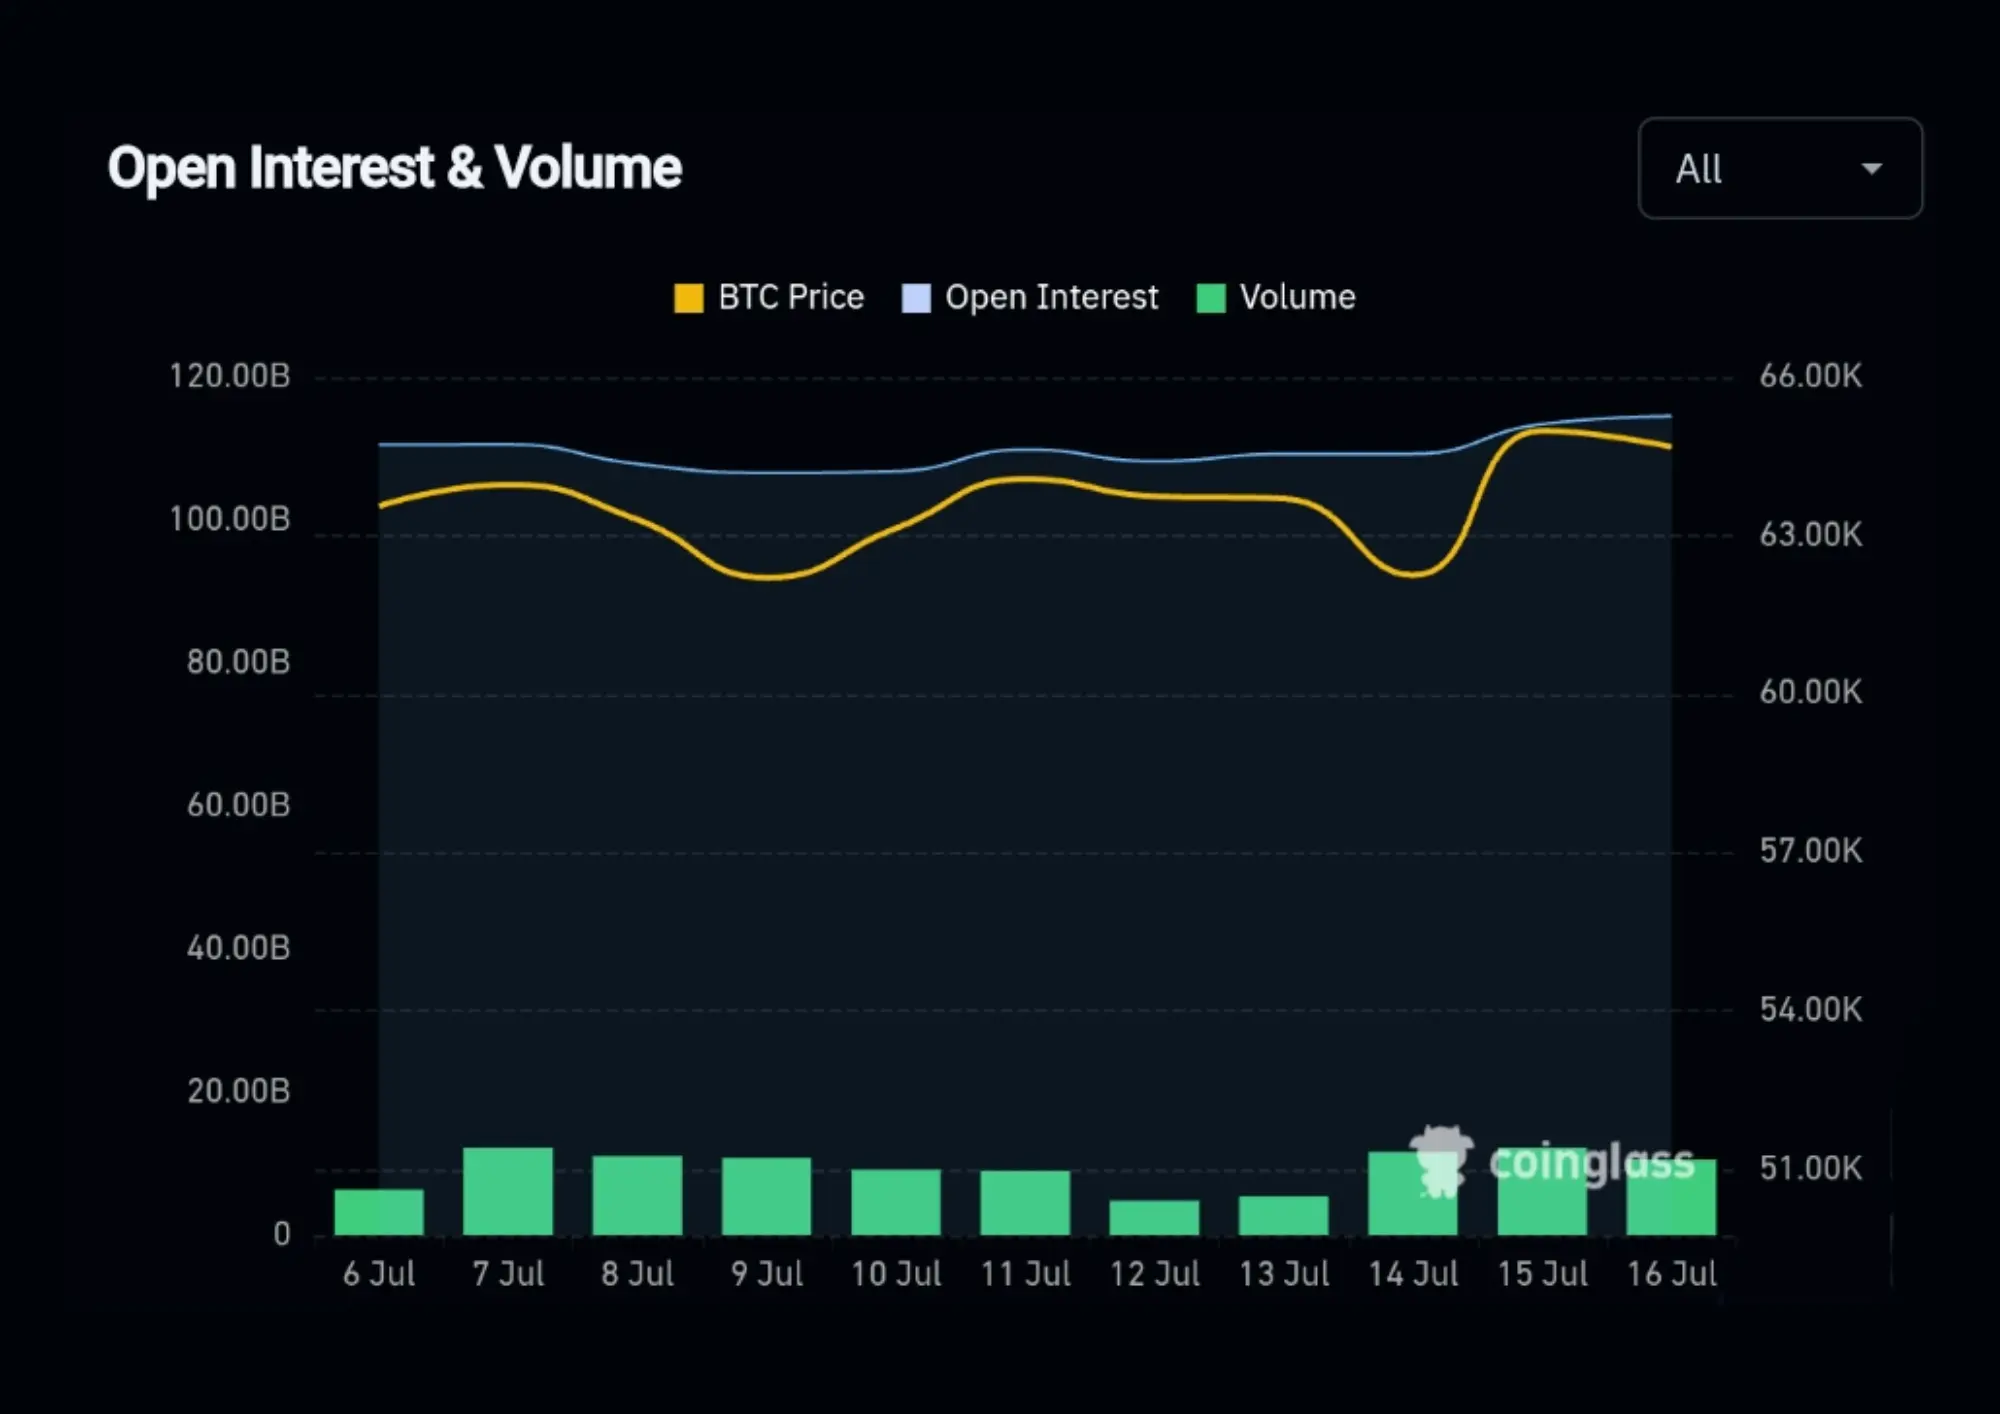
Description, this visualization maps the ongoing relationship between bitcoin price action, open interest, and daily trading volumes over the past several days.
Looking at the broader historical volume trends throughout this month, we can observe how liquidity has flowed through the market. Early in the month, trading activity peaked dramatically near $200 billion before cooling down to a quiet $90 billion during weekend lulls. However, the subsequent rebound back toward the $180 billion level indicates that buyers are quickly stepping back in to provide liquidity whenever the price faces pressure from the surging US dollar.
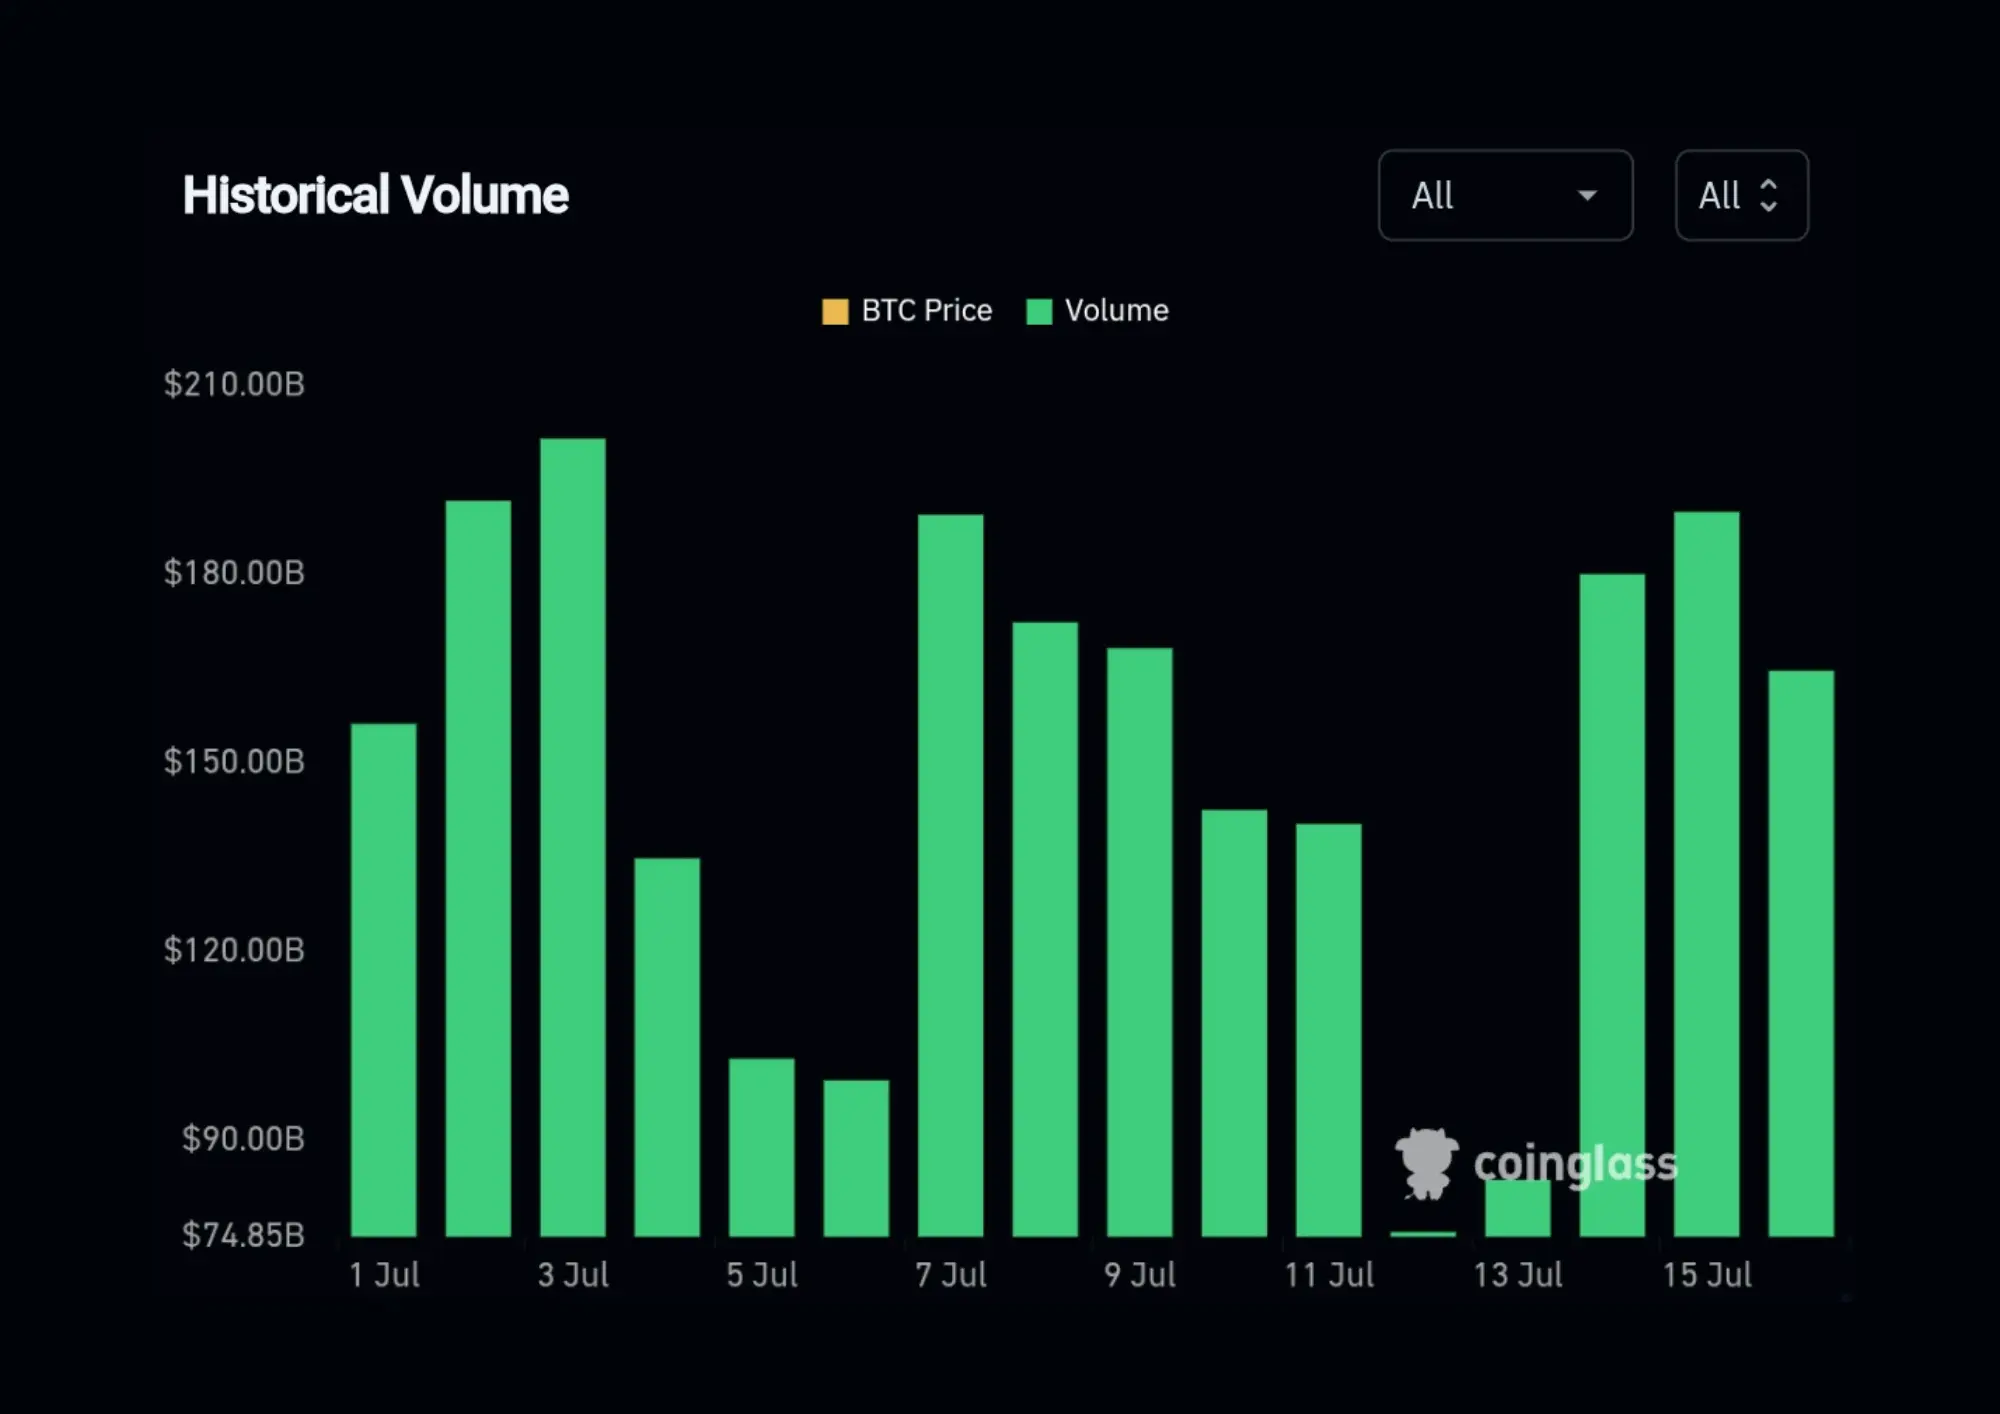
Description, this chart provides a clean comparison of daily historical trading volumes across the current market phase.
Fortunately, this intense trading activity has not translated into dangerous systemic risk. The coinglass derivatives risk index is currently sitting at a very calm 57, keeping the market firmly within the neutral volatility zone. This level is highly consistent with the prior day reading of 58 and is only slightly above the weekly and monthly averages of 55. For active traders, a neutral risk index is an incredibly positive sign because it suggests we are safe from the kind of wild, unpredictable price cascades that usually trigger mass liquidations.
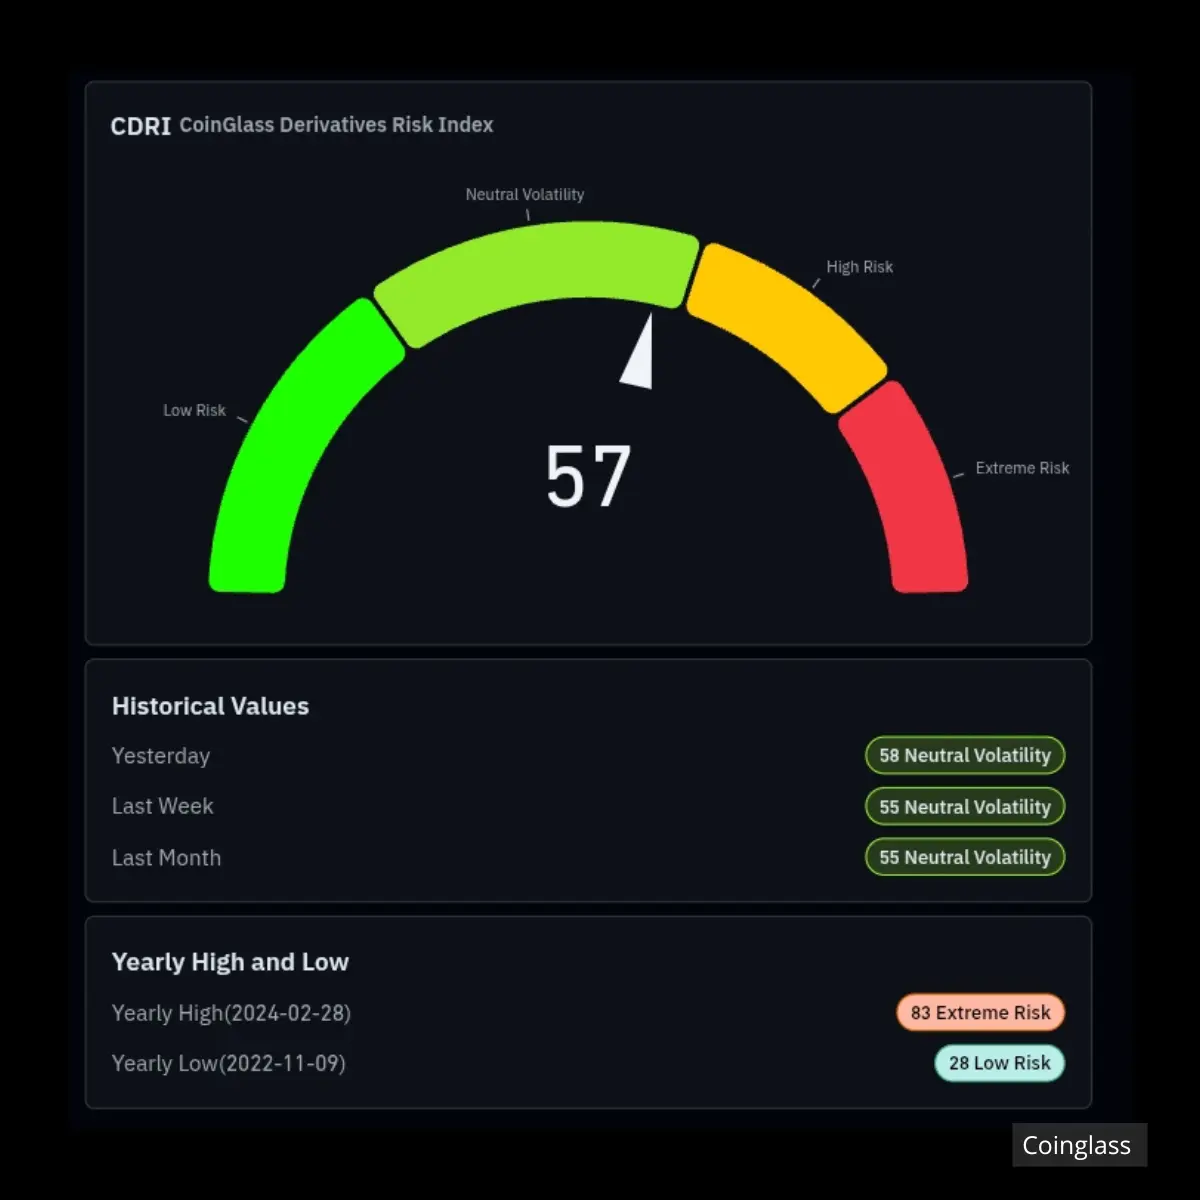
Description, this risk gauge illustrates the current volatility risk within the derivatives sector, showing highly stable conditions.
This healthy trading environment is further confirmed by the coinglass derivatives index, which currently prints at $1614.17 after a minor 2.42% pullback. When we look at the larger picture, this index has seen a steady, long term decline from its late 2025 high of $3550.77 down to its major low of $1386.23. This gradual cooling off is actually a massive blessing for the market, as it proves that a lot of toxic leverage has been flushed out, leaving behind a much more stable and organic price structure.
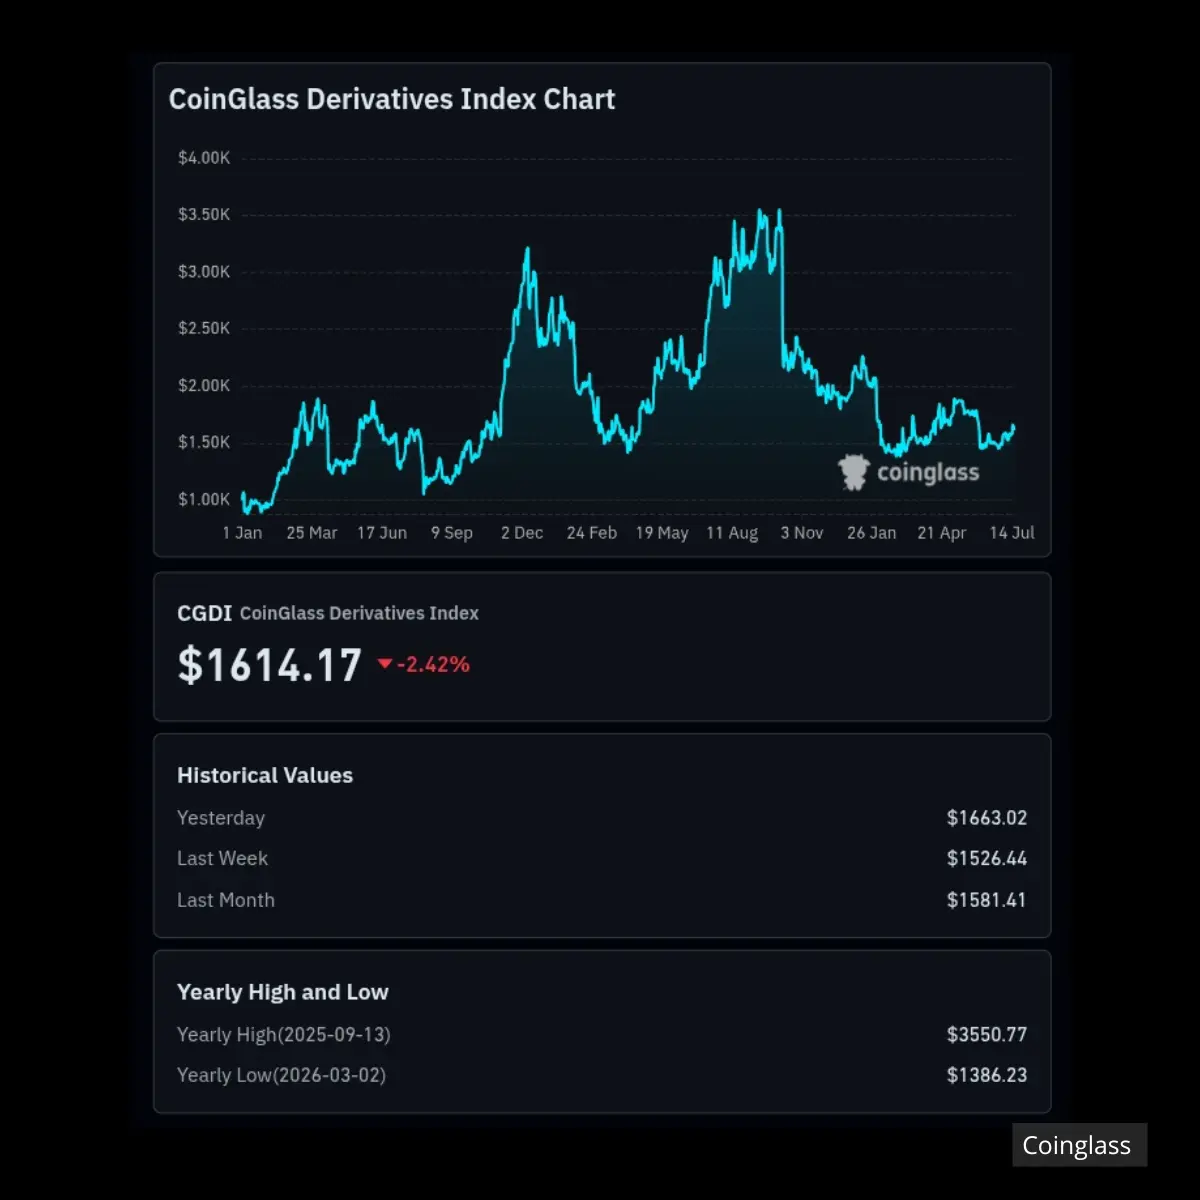
Description, this historical trend chart highlights the long term cooling of leverage within the crypto ecosystem.
For long term investors, the bitcoin power law model is currently flashing a highly encouraging signal. The price of bitcoin is currently hovering right at the bottom edge of its long term growth corridor, commonly referred to as the power law floor. Historically, periods where the price trades this close to the floor represent deep value zones where assets are highly oversold. While the daily charts might look volatile due to shifting central bank policies and dollar strength, the macro scale growth path of bitcoin remains remarkably intact.
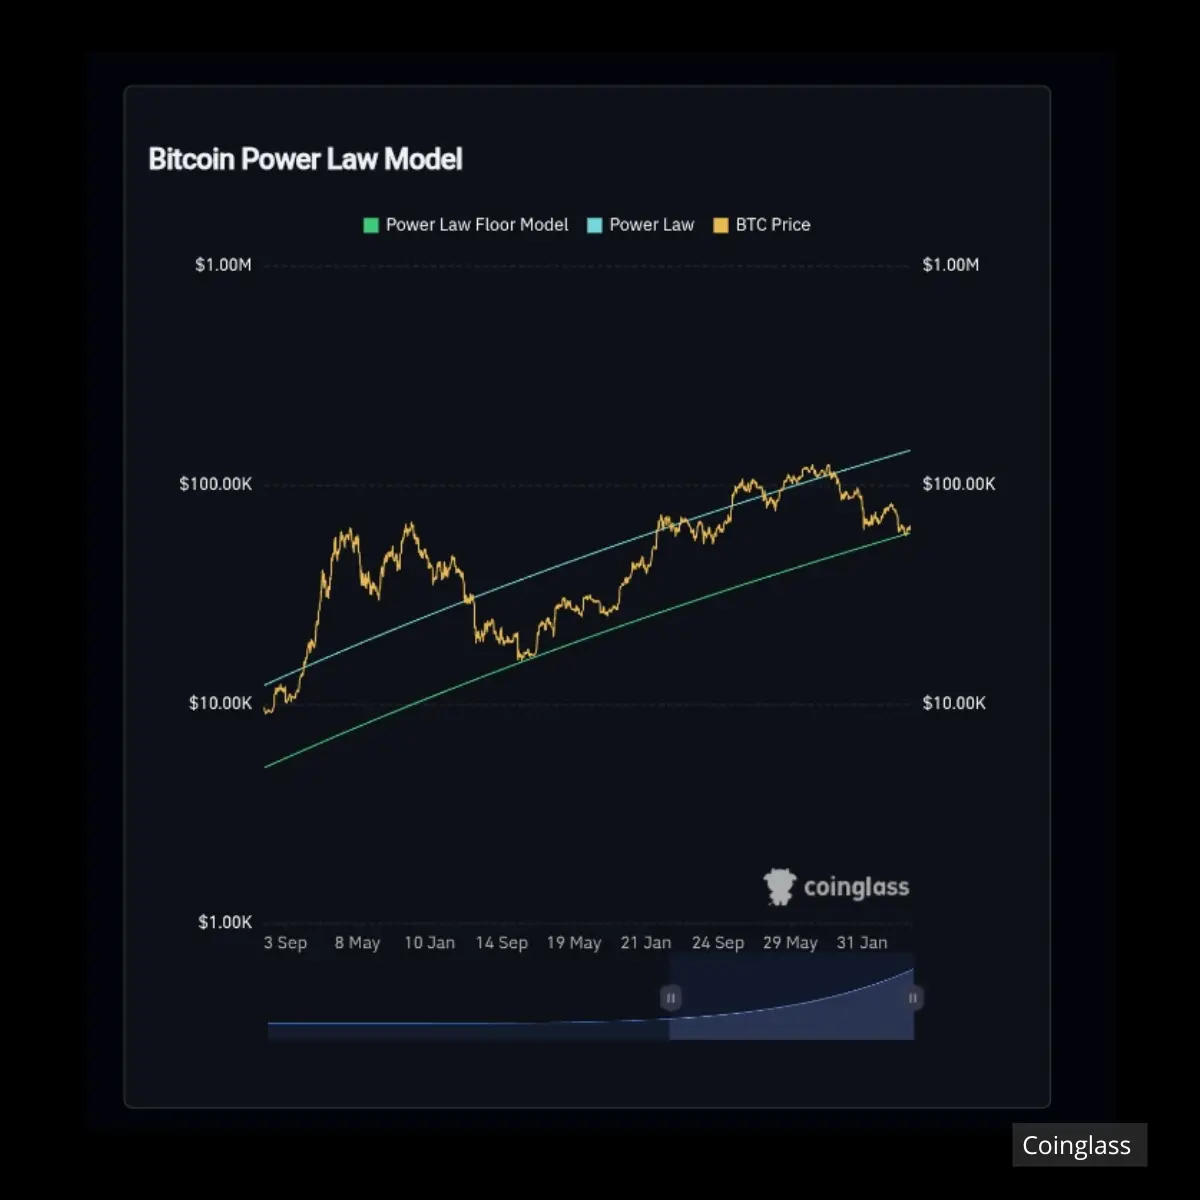
Description, this mathematical model serves as a core framework for evaluating long term Bitcoin valuation.
My Opinion
From my perspective, the recent dip in crypto prices driven by strong US labor and retail data should be viewed as a premium buying opportunity rather than a reason to panic. The derivatives market is showing immense maturity, with the risk index holding in neutral territory and leverage levels sitting far below their historical peaks, which means the risk of a devastating liquidation cascade is incredibly low. With bitcoin resting comfortably on its long term power law floor, the market is quietly cementing a rock solid bottom for its next macro expansion, proving that short term dollar strength is merely temporary noise for patient and strategic market participants.
Click here to read my authentic and original analysis
Source
- US Retail Sales and Jobless Claims Outlook
- USD Forecast 2026: Dollar Outlook for the Next Six Months
⛔ Disclaimer: This article is strictly for informational and educational purposes only. It does not constitute financial advice, and no trading signals are provided.
Financial market trading including crypto, forex, and stocks involves high risks. While there is a potential to achieve substantial profits, there is an equal or even greater risk of experiencing severe losses, including the loss of your capital. Past market performance does not guarantee future results.
All investment decisions are your sole responsibility. Please ensure you conduct your own research (DYOR) before making any trades.
Keep trading and stay profitable📊






