
Bitcoin Observations
This is NOT investment advice.
Download Bitcoin Stacking Browser Extension
_________________________________________________________________________________________________________________________________________________________
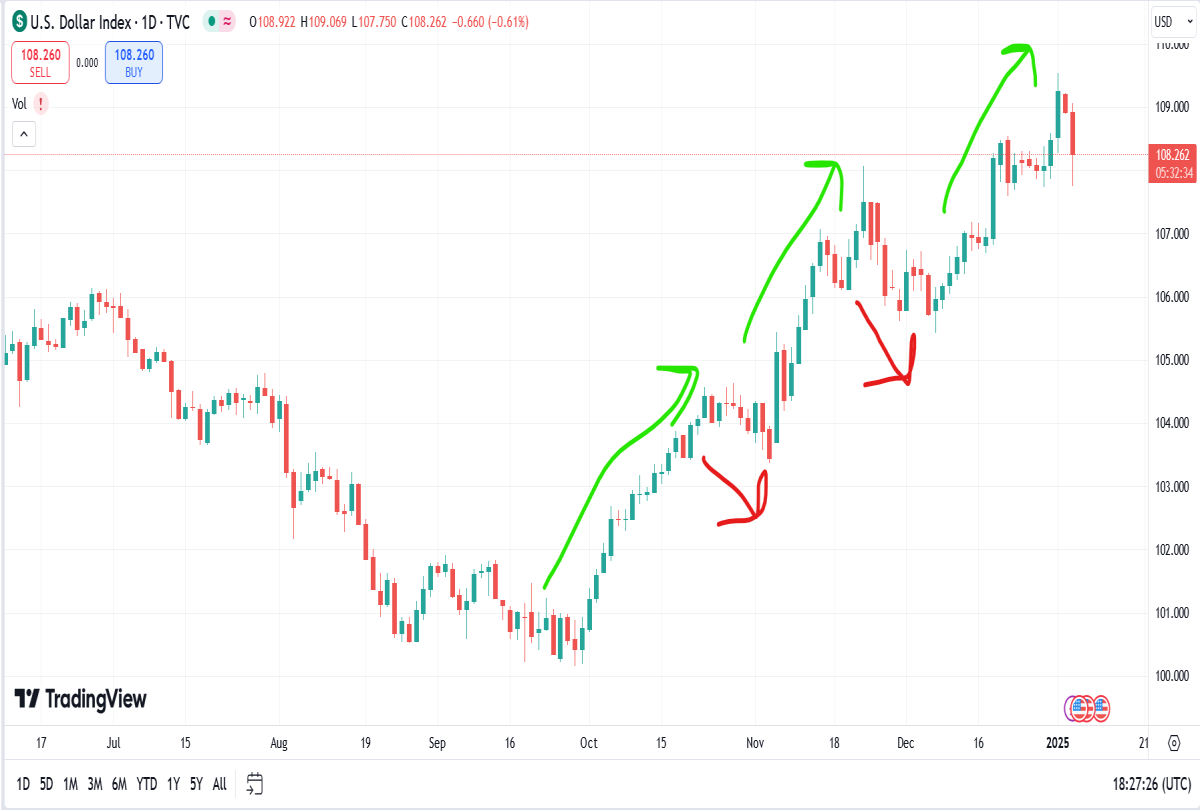
Did DXY Just Give Us a 5 Wave Move?
Charts are useless?
Why Are You Such a Doom and Gloomer?
I'm not. I try very hard to maintain an extremely open mind while focusing on what I consider to be reality and market trends, signals, patterns that have reasonable to very strong foundations, and many other things. Things don't always end up all peaches and cream, so why expect them to do so? Of course it's always easy to look retroactively at say a chart or whatever - but why ignore the realities of what these data points and charts are showing you ahead of time potentially?
For example - let's take a look at a very long term chart of RRP - Overnight Reverse Repurchase Agreements. What? Reverse Repo - you know . . . . . . this is where the Fed sells securities to banks (mainly UST and MBS) with a GUARANTEE to buy them back at a specific price and at a specific time. Think about it . . . . . . . . .
How convenient. The Fed can sell you bonds/debt and you already know when the bailout is coming and you will get back liquidity, regardless of the instrument's market price at the time. The financial media and Fed will pooh pooh this as if it is no big deal. If that is the case, then why did we see an absolute explosion of this relative to what we have seen historically (to include the 2020 Covid scam/fraud meltdown)?
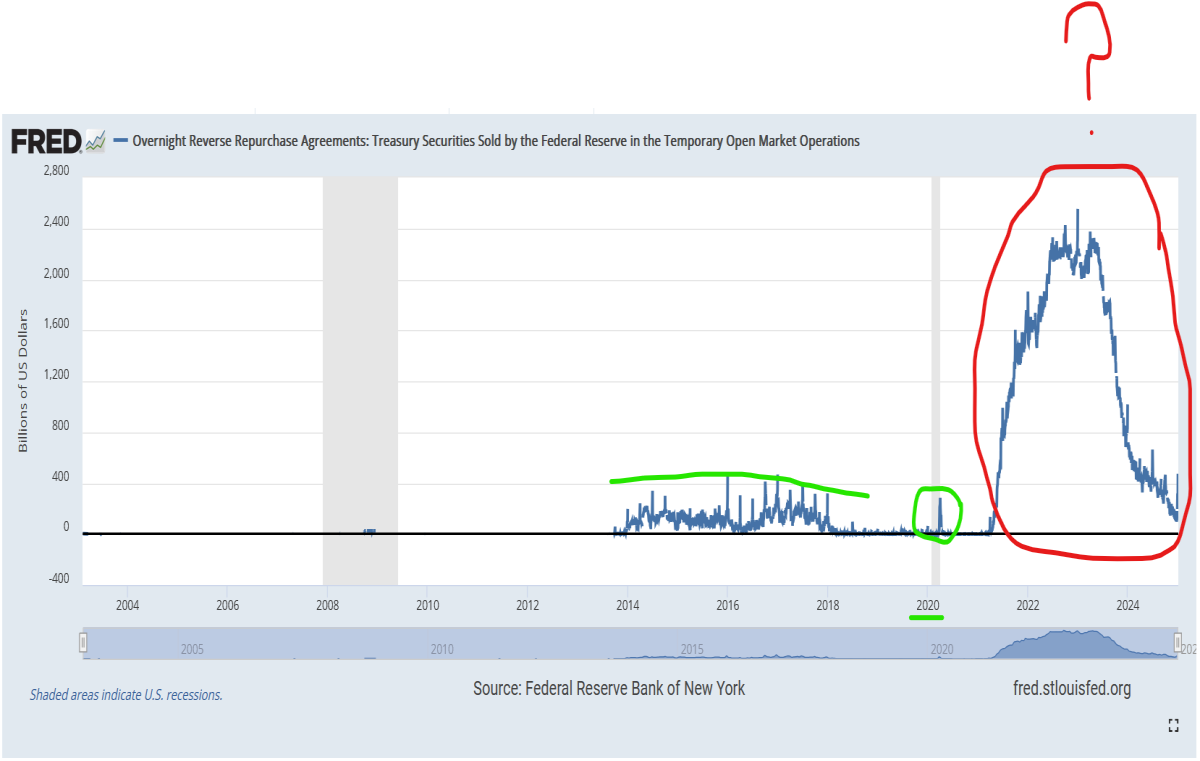
When the Fed buys back the securities, as per the agreements, this injects liquidity into the system. RRP rolling over demonstrates that the liquidity injected via this mechanism has dwindled down to almost nothing.
London Liabilities
The chart shown below reflects the PRICES of UK 10Y Gilts. Remember - bond prices move inversely with yields. No free lunch.
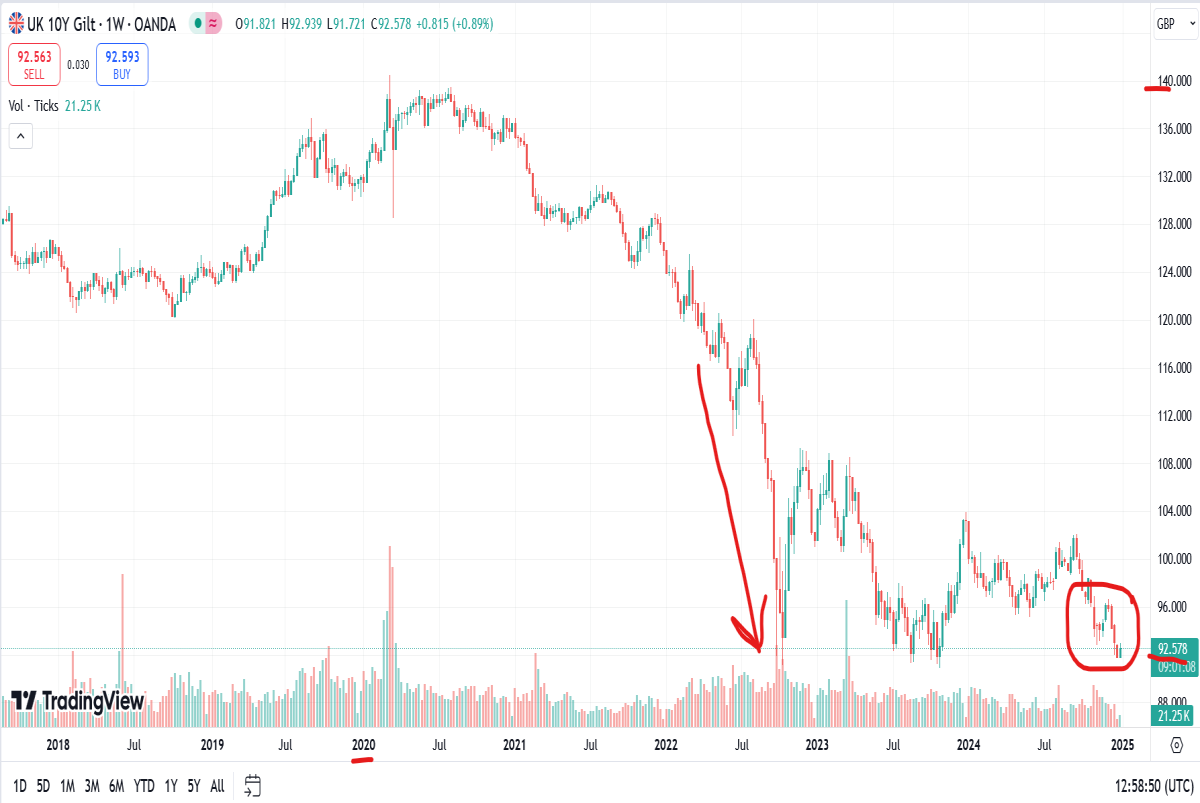
140 to 92ish in the last four years or so. Folks - these are bonds. Flagship bonds of one of the most advanced economies on the planet. These bonds serve as collateral among other roles and have a wide ranging impact on the economy and financial markets. Just a few weeks back the Bank of England told the public it would hide names of troubled players from the public. I wonder why.
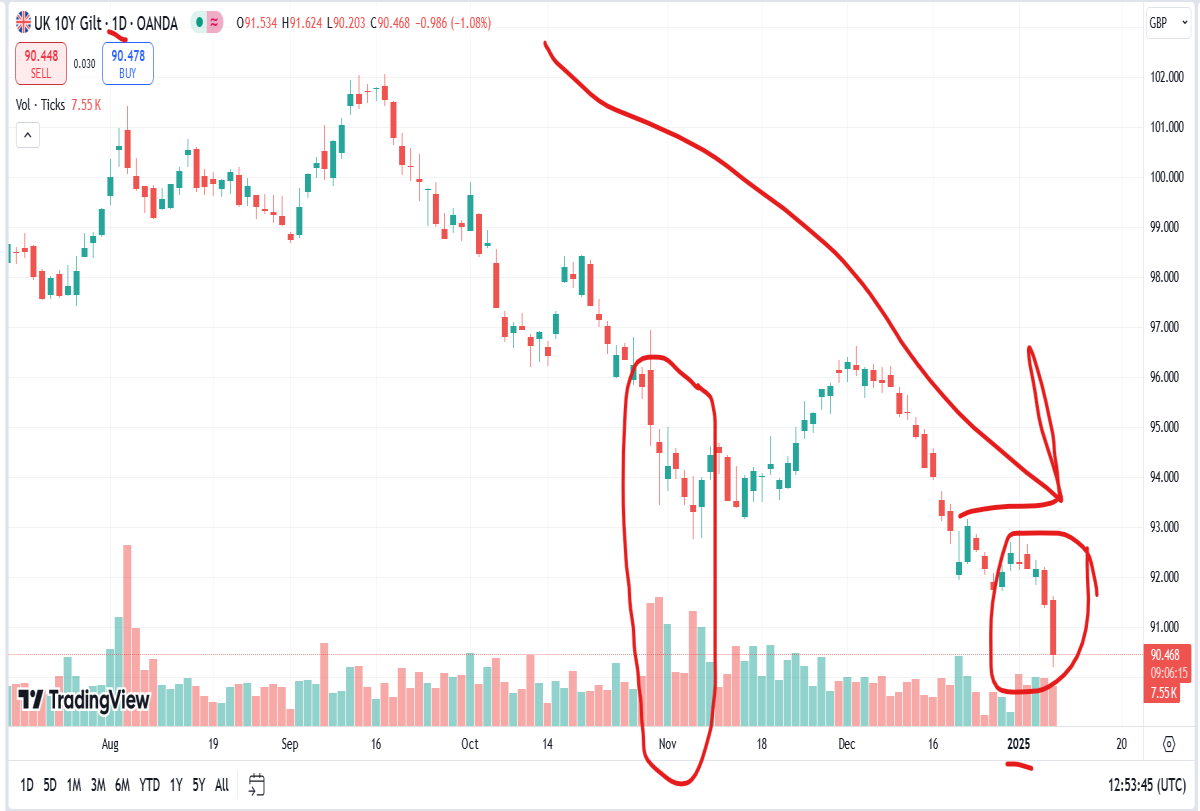
Here is the daily chart to show you a bit more detail:
Czech National Bank
He said, she said. Who cares? The point is that a "Central Bank" if you will even leaked out the possibility that it is considering adding Bitcoin to its reserve asset mix. If this bank is considering it . . . . . . . . .
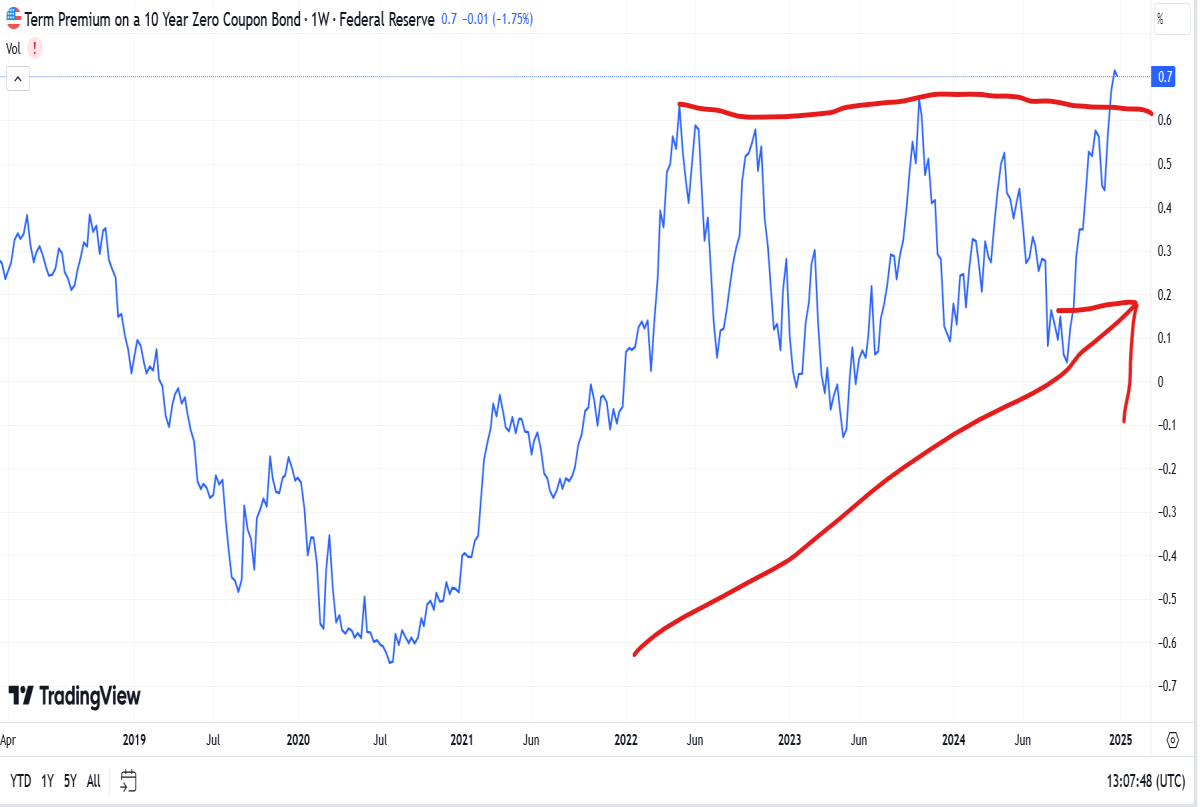
Auctions and Premiums
ZH reported on the first bond auction of the year for 3 year term paper, and it was not very good. There are quite a few bond auctions to track as time goes on, and it isn't fair or prudent to cherry pick any particular good or bad one. Sometimes it looks as though the Treasury does whatever it takes to make a bad one look much better a week later so who knows what is really going on. I think we can all understand the overall trend.
Here is a weekly chart for the Term Premium UST10Y:
Giant Step Forward . . . . . . . or Backwards?
Currently evaluating and putting together a potential transaction to add forward hash via an entity that controls my mining business. Will provide updates.
So where is Bitcoin trading? In a prior post here, I took a wild stab in the dark that we could be entering into Wave 2 of a very major 5 wave bullish move. Time will tell. Let's take a look at a couple charts.
4HR:
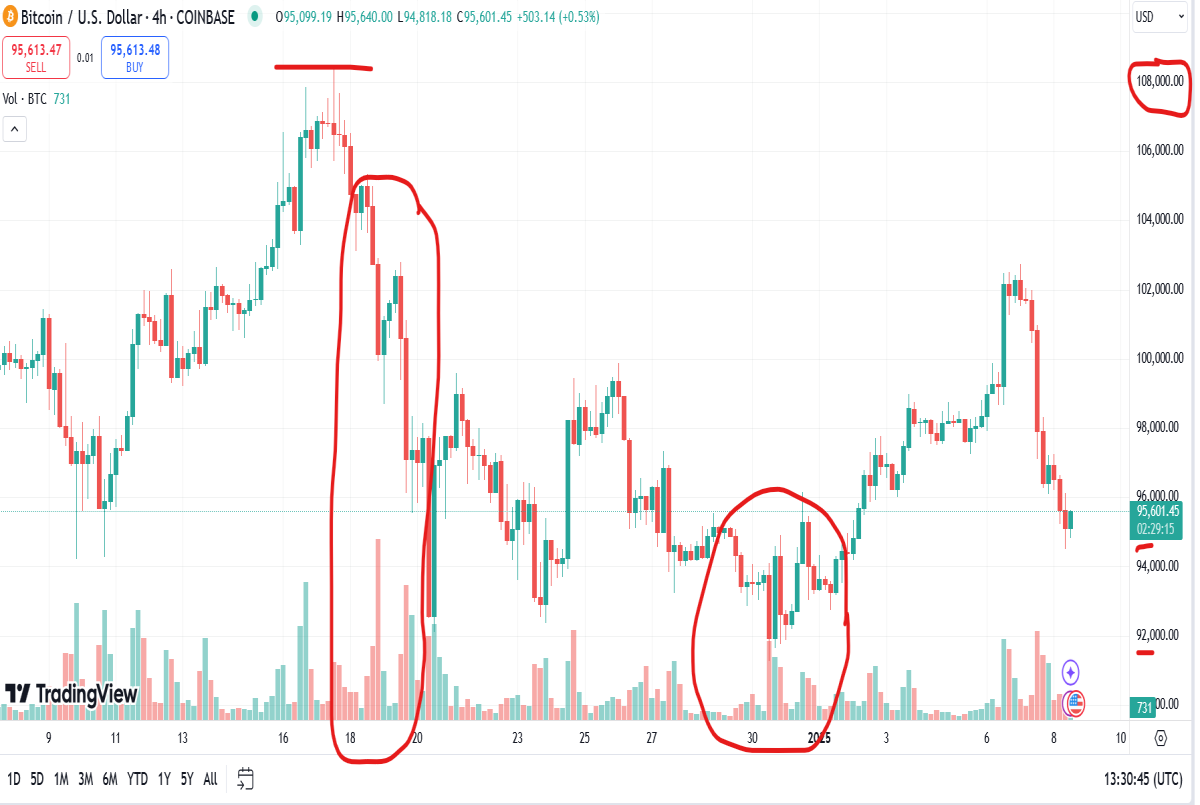
We see some modest distribution here generally oriented around key technical levels - i.e. degens trading with 10x or even 50x leverage get knocked out when you see moves of more than 2% or so. To me this doesn't look like any type of significant breakdown but rather a correction and consolidation. Seems to focus on 91K/92K and 94.5K a bit. Also note the lack of upside volume. Maybe it isn't ready yet to move. Time is effective. Makes people sweat it out and make bad decisions thus flushing the markets.
Daily:
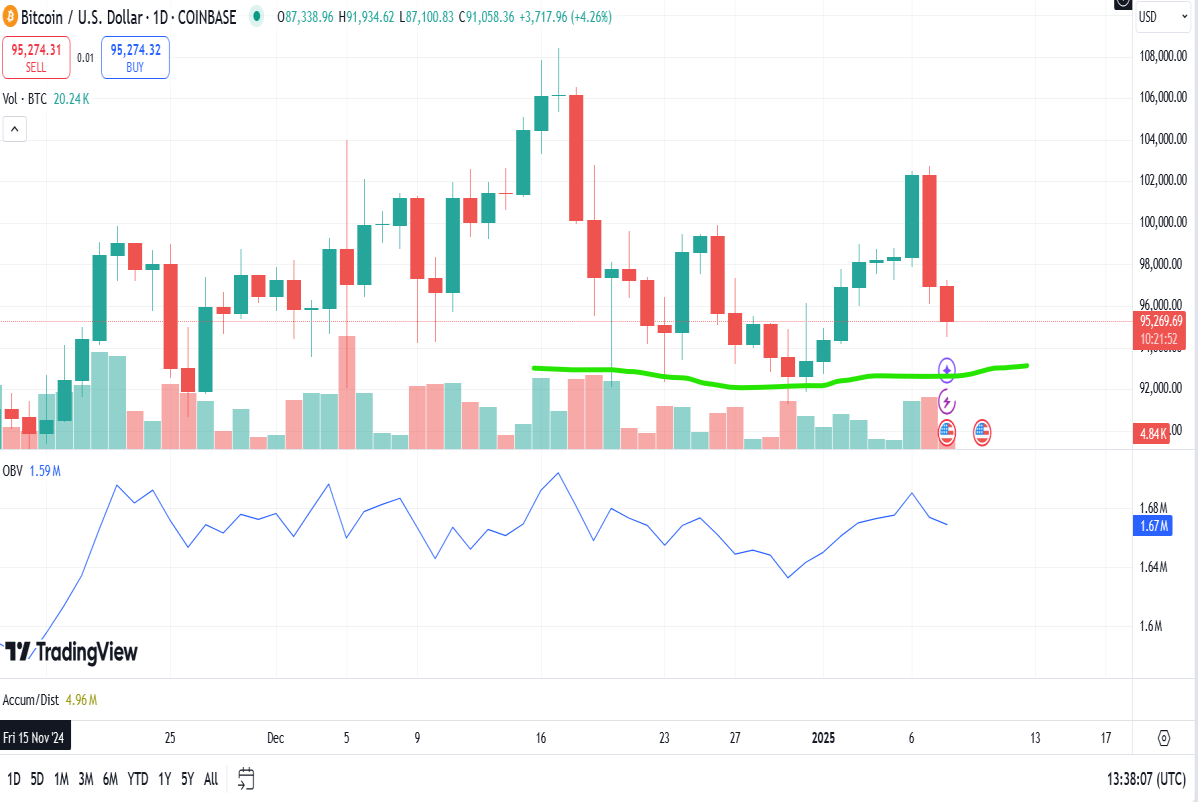
Daily chart above with On Balance Volume - no real signs of notable distribution. For now appears to be consolidating and grinding away inside a correction. Of course that could change which is why we pay attention.
Stack More Bitcoin Shopping With Helpful Browser Extension
Download the sMiles Browser Extension and stack sats buying the stuff you are already buying.
Earn Free Bitcoin Playing Games
Get Free Bitcoin Automatically


