This is NOT investment advice.
____________________________________________________________________________________________________________________________________________________________________
Collect Bitcoin Rewards On The Map - Promote Your Business or Yourself
Risk On vs Risk Off
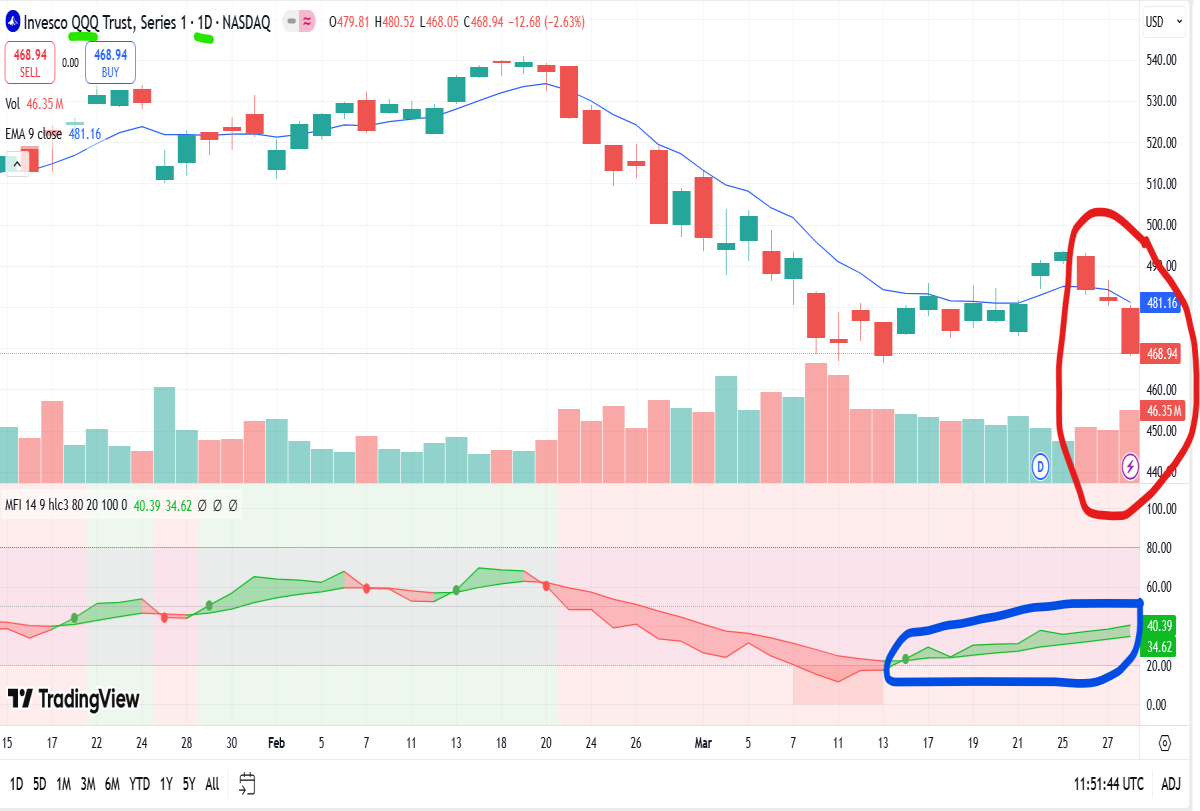
Facts are facts. The Nasdaq encountered substantial distribution in Q1. See blue arrow. We have not yet seen a week like that with a big rebound on big volume.

Looking more closely at the daily, we can see that even with a very flimsy IBD FTD, QQQ kept trying to bounce only to fail again. That said - almost looks too good to be true from the short side, so expecting major volatility potentially in the very short run i.e. the coming week. Market loves to inflict pain in both directions. To the extent that last week looked too obvious for bulls with all the opportunities to bounce, entering this week feels in some ways too obvious for shorts in the very short term.
2YR
Powell has pegged this 2 Year Note at these levels for over three years now:

Let's look a little more closely at recent action:
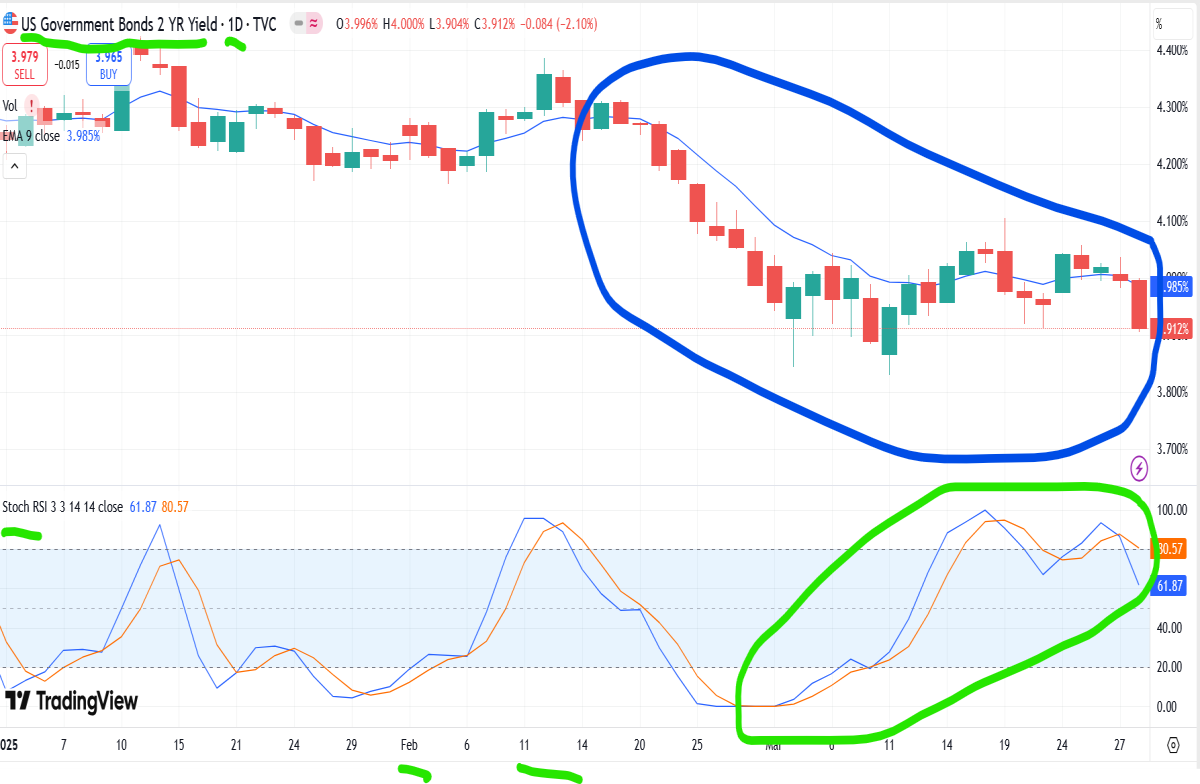
I could argue that the 2YR has not been the worst place to hang out since mid-February, but why? Going back to the first chart, the weekly, we can see the market has attempted this before a few times - front-running the Fed on cuts. To me this is an intriguing metric to watch for how much the market is betting that the econ data tumbles in the short run. Seems like they are chipping away a bit more each week these days. The above reflects yields, meaning investors have been buying more driving the prices up and yields lower. We haven't even started earnings season yet, a chance for every company in the market to blame all of their problems on tariffs if they are going to cough up numbers that come up short.
HYG
Why would we look at high yield corporate bonds? These tend to include some of the most economically sensitive corporate debt instruments. They are at the higher end of the risk spectrum so many look here for cracks in the economy to show up first as a warning sign. HYG is also encountering meaningful distribution:

Hard vs Soft Data Market Reactions
I am going here only because of the market reactions and the fact that they have been impactful and quite divergent bonds vs equities. The age old question: "If equities are so smart, why are they always reversing course and following bonds?" Nonetheless - everyone can take their own political slant on the UMich inflation expectations data, but the fact is bonds and stocks have been viewing it quite differently. First, the data from ZeroHedge.com:
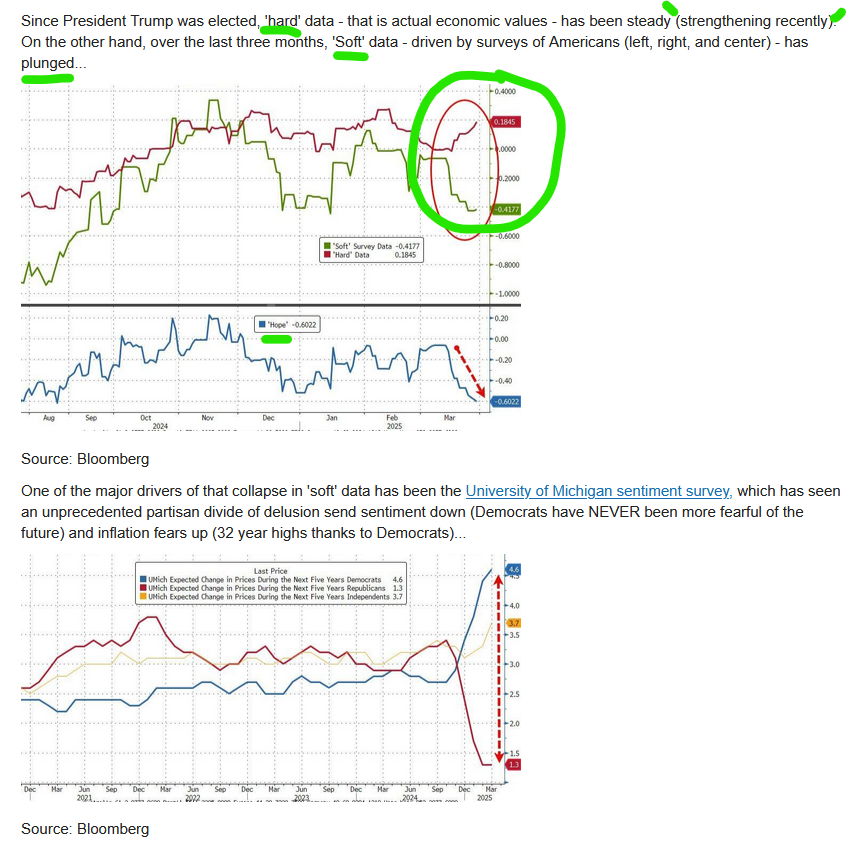
Reason why it does matter is because it tanks stocks and we all know that currently BTC still aligns tightly with QQQ/Software. Beyond that it is very important in my view to see and understand how and why bonds are looking at this compared to equities.
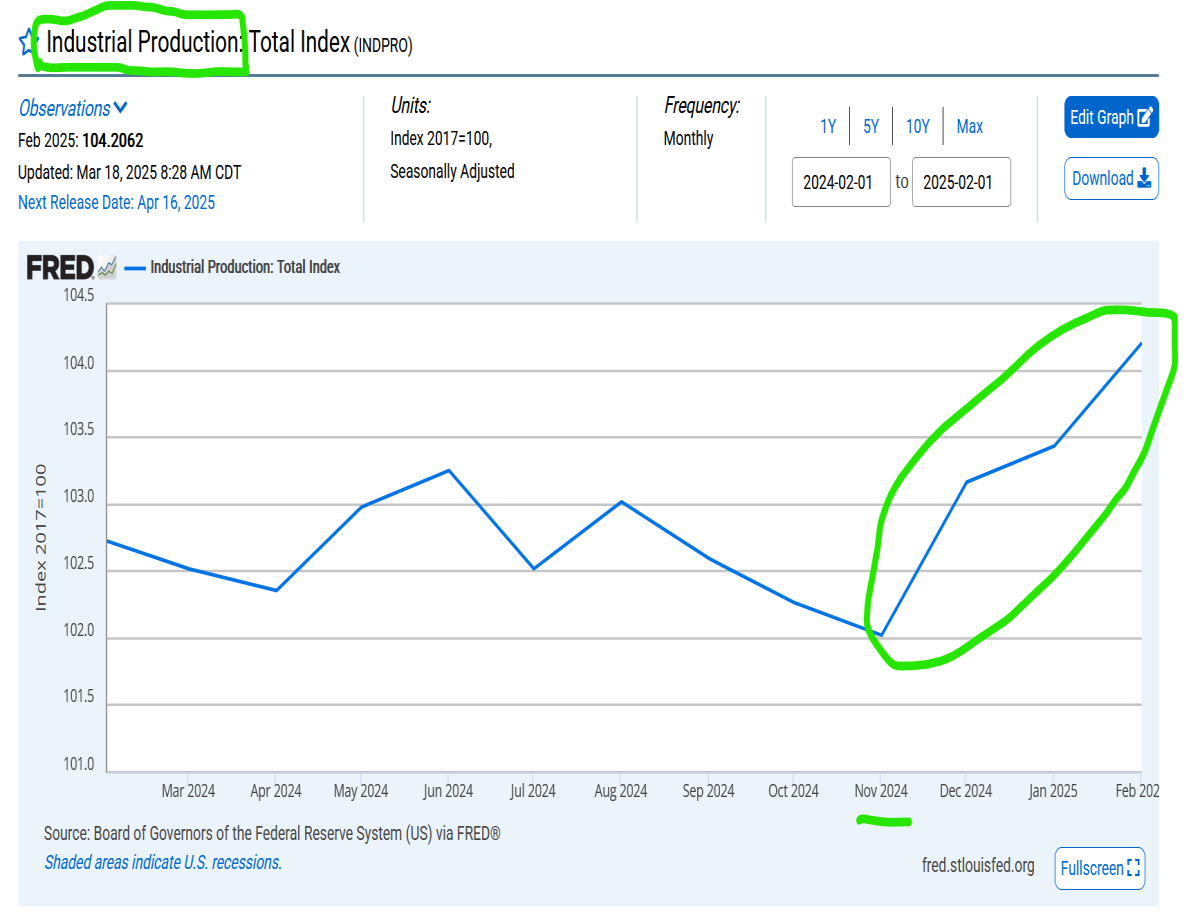
According to the Fed's own data, Industrial Production has been steadily rising since the election. Whether one likes tariffs or not, we have seen dozens of announcements of re-shoring production and foreign companies starting or increasing production in America. Who's right, bonds or stocks? Stocks are telling me they know more about discounting inflation than the bond market does. Bonds are telling me they do not agree that inflation expectations are currently at a 32 year high.
Production drags along jobs, wages, income, spending, and can impact the velocity of money ultimately. Increasing production can and will boost the domestic economy, but the question remains how/when and the impact that has on BTC (indirectly via Risk On/Off) in the meantime.
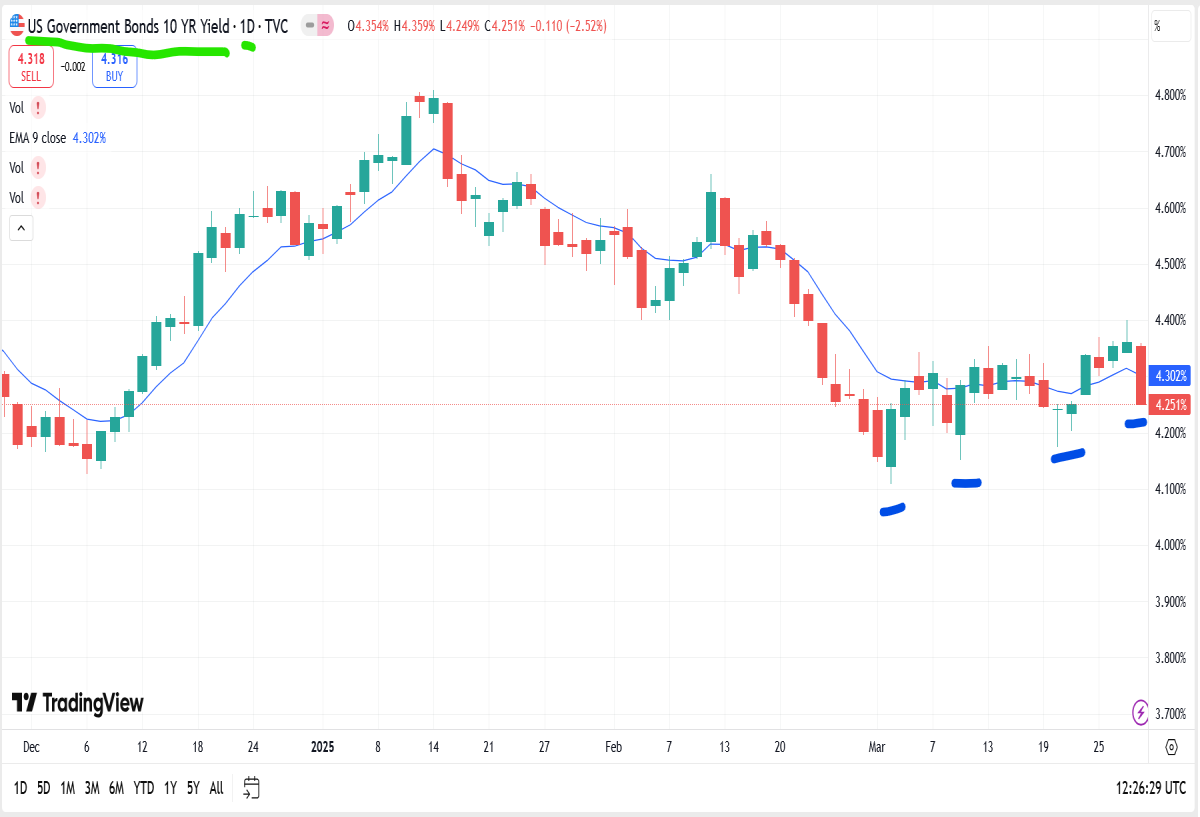
So what does the 10YR Note think? Check the blue dashes, though bonds seem to be comfortably absorbing inflation data and tariff turbulence, they are not exactly setting new lows for yields lower than the early March low or sub 400 BPS . . . . . . . . . even with a massacre in stocks on Friday.
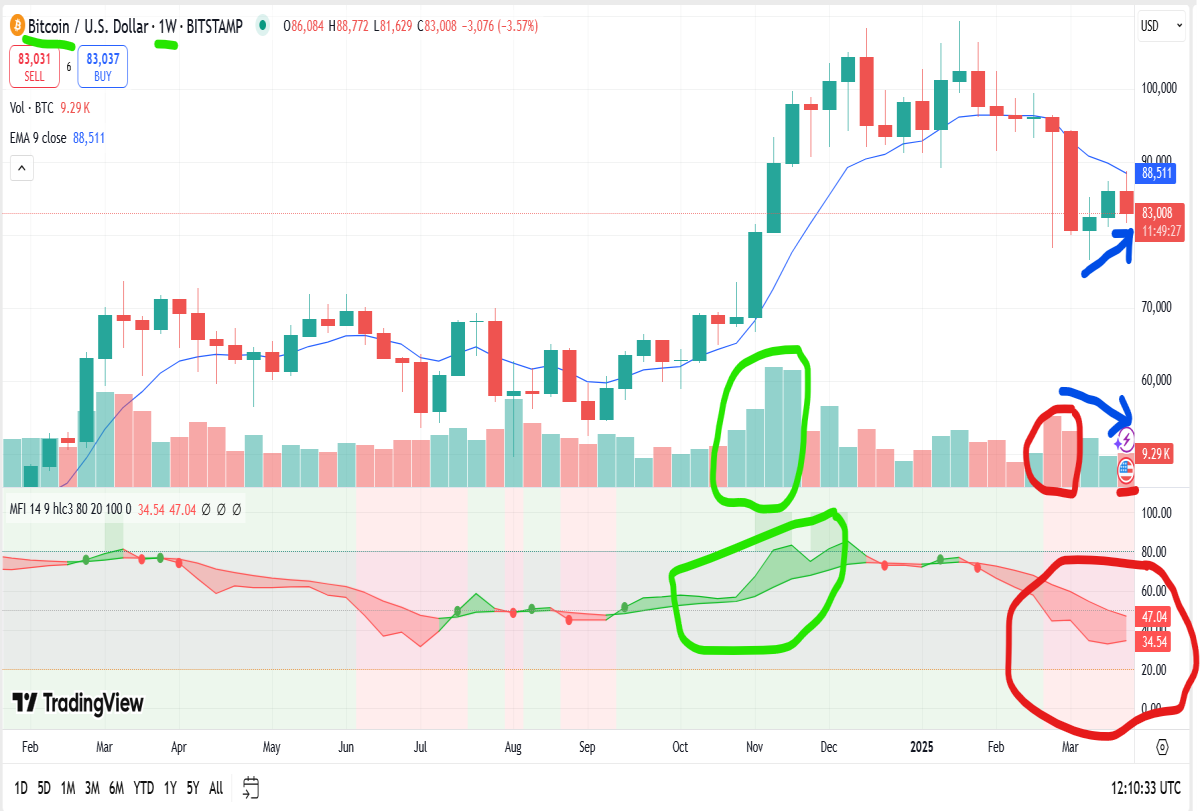
Bitcoin Weekly
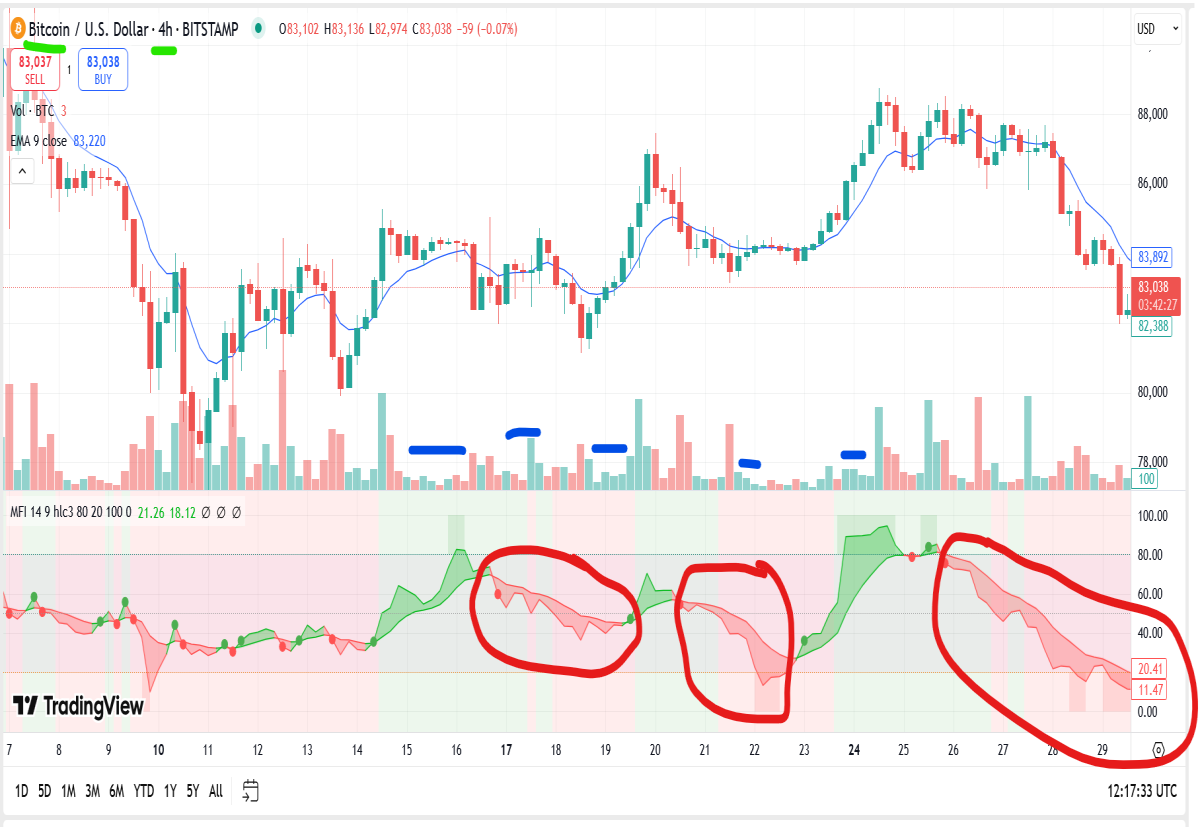
Bitcoin 4HR
Can't seem to get any volume to stick and follow through to the upside for now:
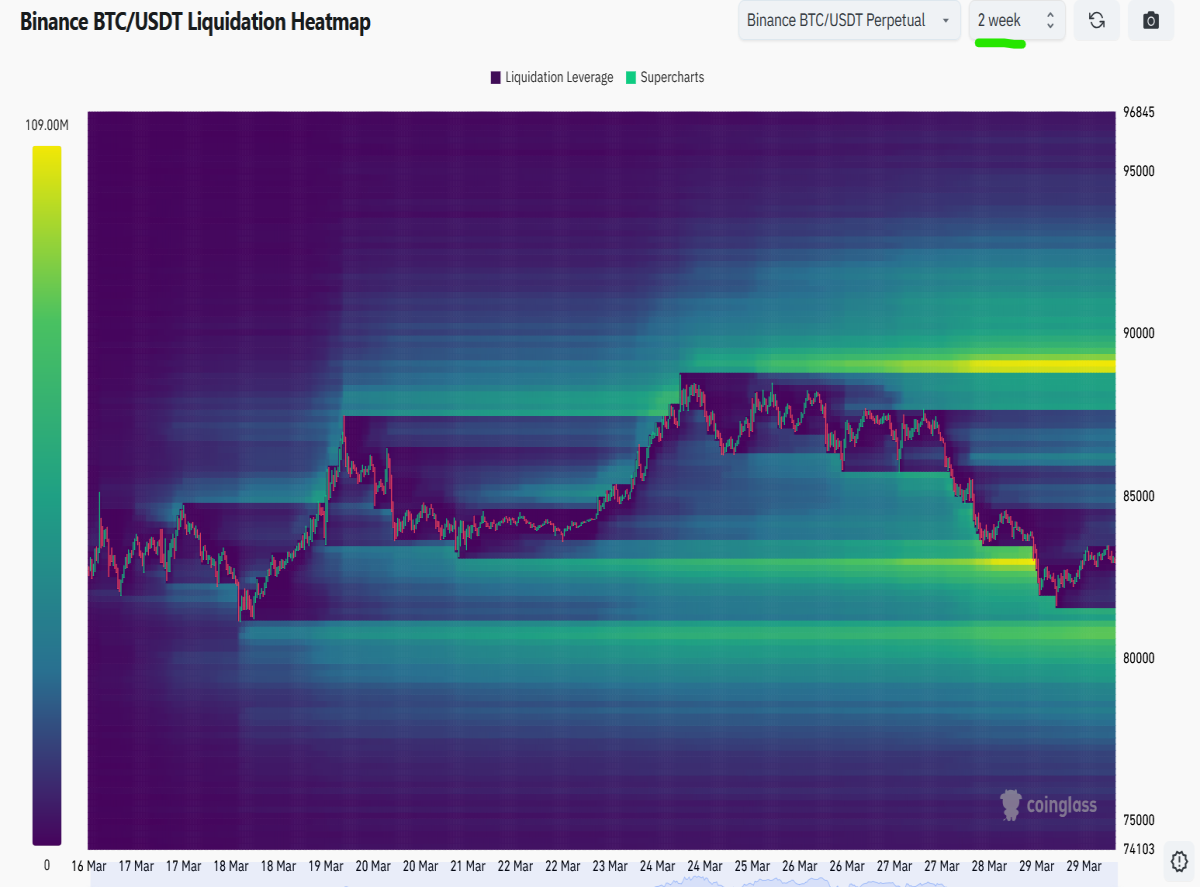
Liquidation Heatmap
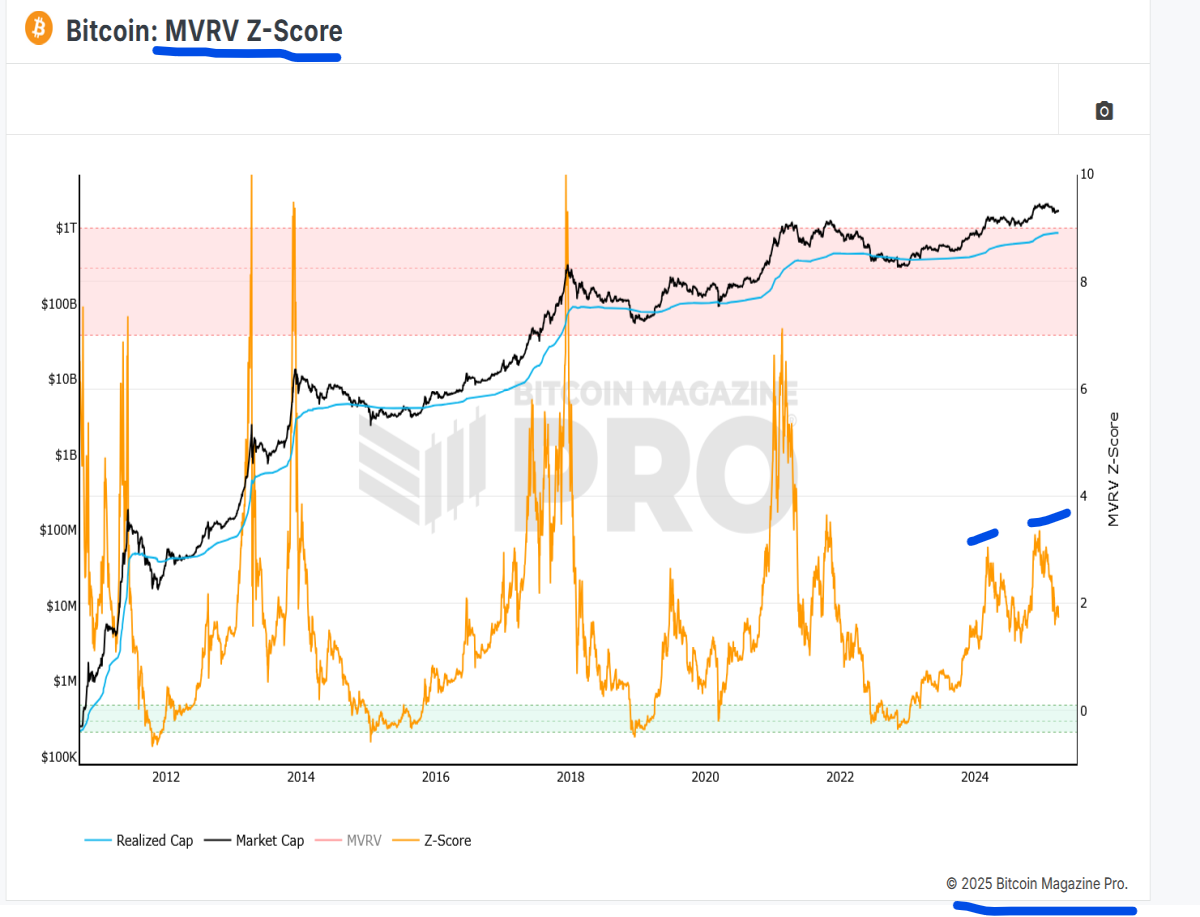
MVRV
BitcoinMagazinePro.com Video Update
I'm open to multiple different tools and resources and am always looking to learn more. From a foundation standpoint, I'm fully absorbed in Price/Volume but there are a lot more tools above and beyond that. BitcoinMagazinePro.com, along with some of their peers I've mentioned here like Glassnode, puts out good data, information, and analysis. Here's a new video that takes a look deep into recent Bitcoin action:
Download sMiles - Promote Your Business or Yourself $10 Min Spend
Download sMiles and enter Bitcoinverse. Collect real Bitcoin Rewards on the map. Promote your business or yourself to rapidly growing large group of Bitcoin earning users.
Earn Free Bitcoin Playing Games
Get Free Bitcoin Automatically