Before we dive into the 3 main principles.. let's define TA!
Definition of Technical Analysis (TA)
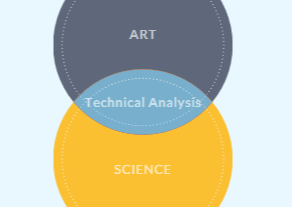
Here is our simple (yet complex) definition for TA.
"The art of identifying the force of an emerging trend until the weight of numerous indicators and principles show or prove otherwise."
Technicians say market action discounts everything as the market’s price already includes all relevant information, so analysis looks at the price trends from history rather than economic, political, fundamental, and news events (external type drivers). Price action also tends to repeat itself because investors consciously and unconsciously create patterned behavior.
The more we take that swan dive into the global world of markets we learn that prices are determined by changes in mass psychology, or what we refer to as social mood.
Let’s dig a tad deeper into the 3 main principles:
Market action discounts everything
The first principle is based on all relevant information (economic, political, financial, ect.) already being echoed within the current market price. The key is to understand what market participants think (sentiment) of all known and all perceived information. There are news items all the time, and if the news items are significant they will show up in the technical indicators.
Prices move in trends
The belief here is prices trend directionally; either up, down, or sideways. To dig deeper into the tenet of trend, Dow Theory within TA lays out the psychological reasons.
As Dow theory goes, markets experience primary (broader) trends, what we typically hear as a bull or bear market. Within these broader trends, there are secondary type trends, which often go against whatever the current primary trend is at the time. These secondary trends can be called pullbacks, throwbacks, or corrections (depending on direction). There are also minor trends, which are what I would call noise within the secondary trends.
History tends to repeat itself
TA chartists believe investors/traders (as a collective) repeat the behavior of those that preceded them. In other words, the conscious and unconscious fear and greed emotion that lives within us is always present. It is all about the people, and the patterns they create. The human emotion people had hundreds of years ago is the same human emotion the people of have today. Market participants create patterns rather they know it or not. If a certain pattern happened many times in the past, and the outcome of that pattern was relatively the same, then you have a high likelihood that fear, and greed will form the pattern again.
Quick Overview of TA
A good sentiment or opinion should have a directional view of whatever market you are researching, and should also include the following:
- An entry point (price) at which to buy or sell
- How much risk is involved and what is the expected reward (risk/reward ratio)
- What period of time to hold the position
This goes back to the definition … "The art of identifying the force of an emerging trend until the weight of numerous indicators and principles show or prove otherwise." (it is worth repeating since it is important)
Thanks,
Brian Swan, CFTe Certified Financial Technician & Advisor
Having spent almost 20 years as an analyst, and a price risk manager, I have been working within the sphere of technical analysis, Elliott Wave analysis, and Fibonacci analysis. I learned these types of behavioral analysis tools trading cattle and grains futures for a top cattle broker for over 6 years, and for the past 14 years has used those skills as a Senior Commodity Analyst at Schneider Electric, a global energy consulting firm.
I am certified as a Financial Technician with a CFTe designation through the International Federation of Technical Analysts (IFTA). I am a mentor and coach for anyone who wants to learn how to produce usable charts.
Curious? Ask me questions!