
Hello,
This week's update is on ATOM. The six-month downtrend may be over for Atom. Before we start an analysis of the daily and weekly charts, let's do a quick overview of Cosmos.
Review of the "Internet of Blockchains"
Atom Daily Chart Coinbase

Atomic Weekly Chart Coinbase
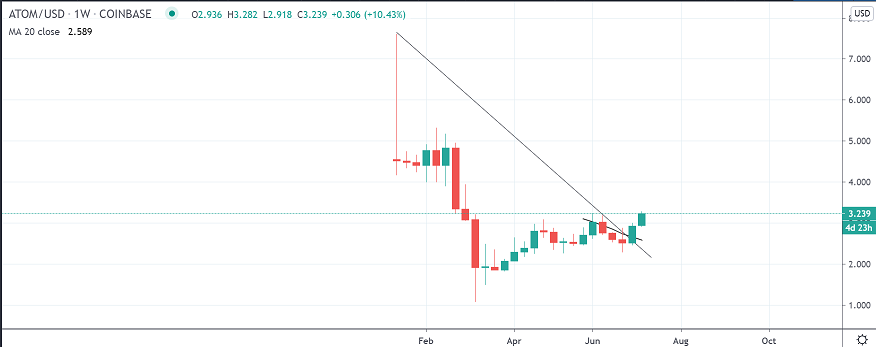
Analysis
My primary Elliott Wave count on the daily chart shows the completion of an ABC correction and 4th wave which has an impulsive move upward toward the 5th wave. The channels and resistance lines give some guidance to where the 5th wave may terminate. A break of the trendline at 3.58 price range would confirm a clear move toward the 5th wave. If the current price action does not break the trendline watch for a pullback within the channel.
The weekly charts show a clear break from the downtrend with a green candle above the trendline.
Happy Trading - 3rd Dog
Note:
I’m not registered or licensed in any jurisdiction whatsoever to provide investing advice or anything of an advisory or consultancy nature and are therefore are unqualified to give investment recommendations. Always do your own research and consult with a licensed investment professional before investing. This communication is never to be used as the basis of making investment decisions, and it is for entertainment purposes only.


