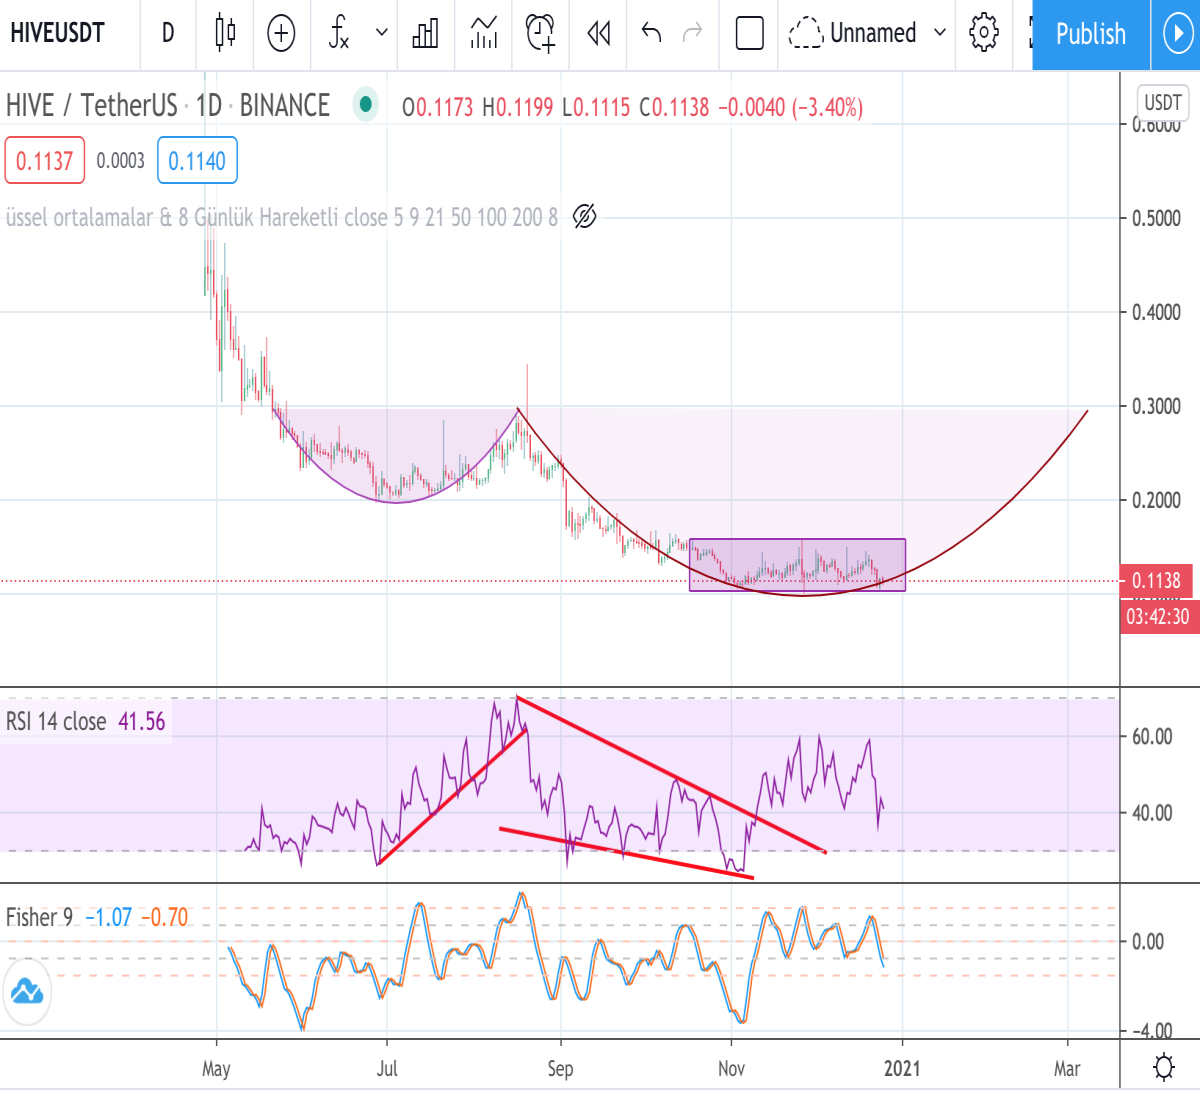
Here is daily chart of HIVE/USDT. It seems like looking for bottom. I draw rectangle. Price moves inside the rectangle. Its high is 0.15 USD and its lowest is 0.10 USD. If we complete for looking bottom, Price may move to complete the big bowl. RSI should move to 60 level and more.