The approval of the Bitcoin (BTC) spot ETFs this week led to some counterintuitive results. The first was that BTC surged briefly after the approval and then dropped in price to the $42k range. For months, I have stated that such was the approximate value of BTC after the approval … and I was right. It proved something of a “sell the news” event.
Also, I was proven correct in my prediction that BTC would reach $47k before approval (link here). I thought I had missed the target last week, but in the few days before approval, my view was affirmed.
A second counterintuitive result also transpired, namely that Ethereum (ETH) surged in value, even after retracing a bit. The reason for this surge lies, broadly, with the view that the odds for the ETH spot ETF approval improved materially with the BTC approval.
I continue to hold that the prospects for digital assets are favorable for the coming year. This means that I think BTC is on track, at a minimum, to reach its all-time high in 2024 and that the same holds for Ethereum--somewhere in the region of a doubling (or better) appears to be in the offing.
Three lessons about the macroeconomy support my view, so I’ll explain them here. This newsletter gives you a sample of what I send to the investors of our hedge fund 1.2 Capital Management, but I’ve altered it a bit for you all--since you’re not the same audience.
Lesson 1- Digital Assets Are Still Small
Let’s begin with a point about the size of the digital asset world. You can check that value (for free) on Trading View. Here’s what you’ll see at the top of that page.
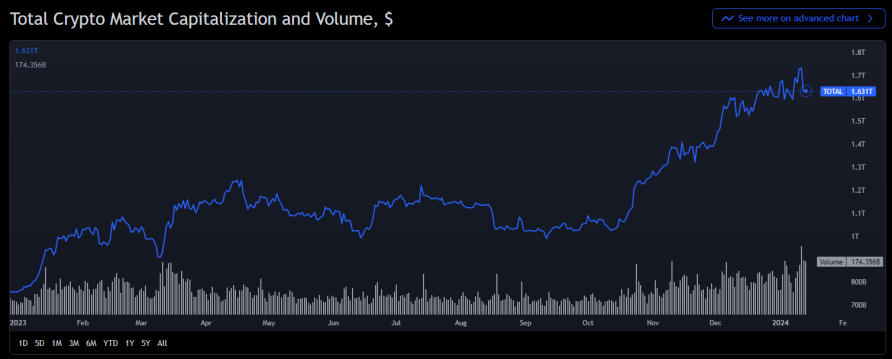
As a reminder for everyone, market cap = price per coin * total number of coins. The TOTAL, featured above, is an index that represents the sum of all cryptocurrency market caps.
That number is revealing because it shows that after the run-up in anticipation of the BTC ETFs, it stands at about $1.61 trillion. A comparison with some TradFi numbers illuminates its significance.
Over on finance.yahoo.com you can search for Apple’s market cap (AAPL). The image below represents what you’ll find.
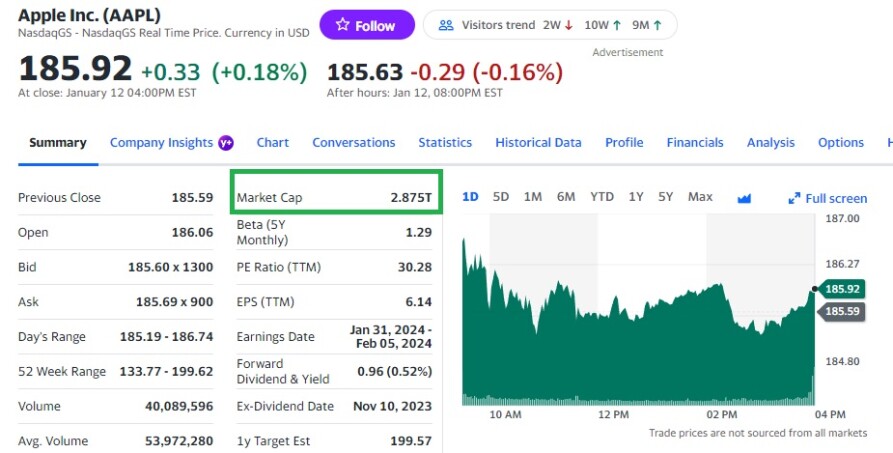
Highlighted in the green box is the number that should command your attention: $2.875 trillion. That is the value of all of Apple’s shares--its market cap.
When compared with the TOTAL, it reveals that the entire crypto market is about 60% of the value of Apple’s stock, which is but a single stock in the S&P 500 (if a large one) … and there are 499 other stocks in that index.
As large as the crypto market has grown, then, you must recognize how small it is relative to traditional finance.
But there’s another lesson buried here and it goes something like this.
Lesson 2 - Liquidity Metrics Have Muted Effects for Small Markets
When you invest long on an index like the S&P 500 (the standard market index), your bet assumes that there is a sufficient level of unencumbered cash (liquidity) in the economy for other investors to follow your bet and increase its value.
A pandemic lesson is instructive. You might recall that the (US) stock market continued to rise despite the fact that literally no retail store was open—everyone was quarantined—and all but essential business was closed. Why on earth would the S&P index rise in those conditions?
The answer, briefly is that liquidity was flush after so many governmental injections, so the market went up.
You can check for that level of liquidity if you navigate to the Chicago Fed’s site and look up their National Financial Conditions Index (and scroll down to the adjusted one). It looks like this.
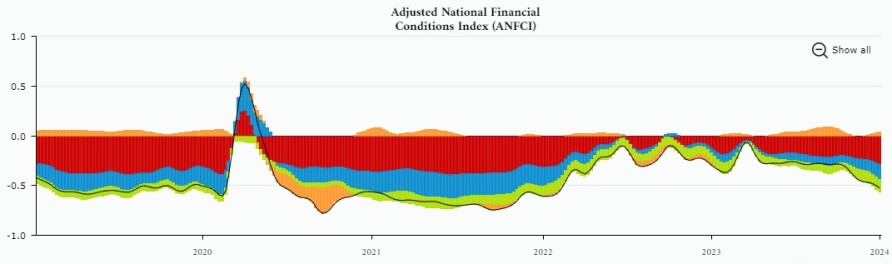
The midpoint indicates that financial conditions are neutral. Below the line means they are loose. Readings above the median line indicate they are tight (typically a recessionary period).
When the main black line below which there is only white indicates the current level of liquidity. When it starts to rise, conditions are getting tighter. You’ll see that happened in 2022 and both the S&P500 and the crypto market plummeted.
Starting in 2023 (with one exception in March when the mid-sized banks reached their crisis point), conditions have loosened. During this period stocks and cryptos have gone up.
Loosening financial conditions do have an impact on cryptocurrencies, then, because they indicate that there is enough liquidity in the economy to support crypto investment. But the effects they have are muted. The Nasdaq 100 had an extraordinary year--one that would have been equivalent to a 500% - 600% return for Bitcoin. Yet cryptos had no such year, only a good one in large caps.
Lesson 3 - Flows Matter for Smaller Markets
In smaller markets, flows matter more. Recall that the digital asset that the market is tiny, at just over half the size of Apple’s stock. What matters more for cryptos is liquidity flows — is more money coming to this market specifically?
It’s hard to get a sense of that, but CoinShares does put together a weekly chart that’s helpful, if incomplete. Have a look.
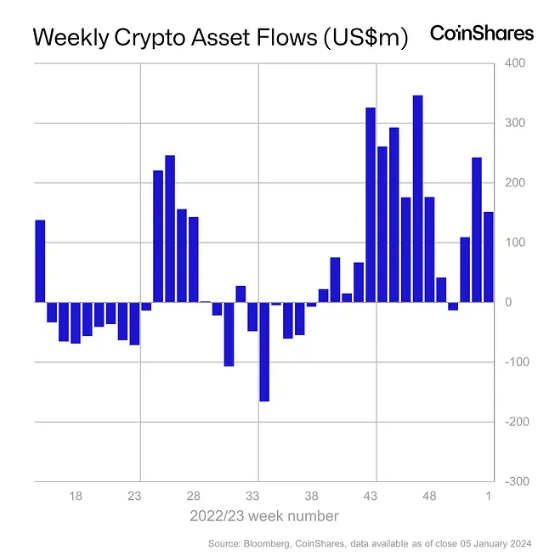
Featured in the image is the volume of flows into or out of the digital asset market for the trailing 52 weeks. Above the line = money coming into the crypto space. Below the line = money leaving. Recently, we’ve witnessed quite a bit of money entering the space.
That explains why November and December have been such strong months for cryptocurrencies, while the middle of the year was an unremarkable period of sideways price action.
While these are not all the ingredients that you will need to construct your own form of the basic economic cycle (BEC) indicator that the team uses, it should be enough to get you thinking along these lines. They’re not half-bad indicators at all.
They also suggest that the macroeconomy is flush with liquidity and that that liquidity is flowing into the crypto space. The future looks bright at the moment.
Happy Trading!!
👉Subscribe to our Free Investment Bulletin.
Finally, if you learned something, hit that UP ARROW ⬆️ and SHARE. 🔁
Disclaimers and Disclosures
This post is provided for educational and entertainment purposes only and should not be relied upon for business, investment, taxation, or legal advice. You should consult your own advisors for those matters. References to any securities or digital assets are for illustrative purposes only and do not constitute an investment recommendation or offer to provide investment advisory services. Furthermore, this content is not directed at nor intended for use by any investors or prospective investors, and may not under any circumstances be relied upon when making a decision to invest in any fund managed by 1.2 Capital Management. (An offering to invest in a 1.2 Capital Management fund will be made only by the private placement memorandum, subscription agreement, and other relevant documentation--all of which should be read in their entirety.) Any investments or portfolio companies mentioned, referred to, or described are not representative of all investments in vehicles managed by 1.2 Capital Management, and there can be no assurance that the investments will be profitable or that other investments made in the future will have similar characteristics or results.
The views expressed here are those of the individual author and are not the views of 1.2 Capital Management, 1.2 Labs, or their affiliates. Certain information contained herein has been obtained from third-party sources. While taken from sources believed to be reliable, 1.2 Labs and affiliates have not independently verified such information and make no representations about the enduring accuracy of the information or its appropriateness for a given situation.
Finally, as the author of this report, you should recognize that I do actively invest. Many of my trades are quick and I do write about many investment items, whether stocks, digital assets, collectibles, and the like which I do not own. For the purposes of disclosing any conflicts of interest, assume that if it is covered, I own the investment item. Or if my coverage is negative that I am short the investment item.
NOTE: An earlier draft of this article was written and posted here.