
Data as of October 6, 2026
Bitcoin is trading around $86,000, yet US spot crypto ETFs just recorded roughly $118 million in combined outflows.
That said, Bitcoin barely moved on the news
The data suggests that Monday's ETF selling was too small to overwhelm broader liquidity, but the bigger question is if that changes if the outflows persist.
What Was the $118M Outflow?
On October 5, US spot ETFs recorded:
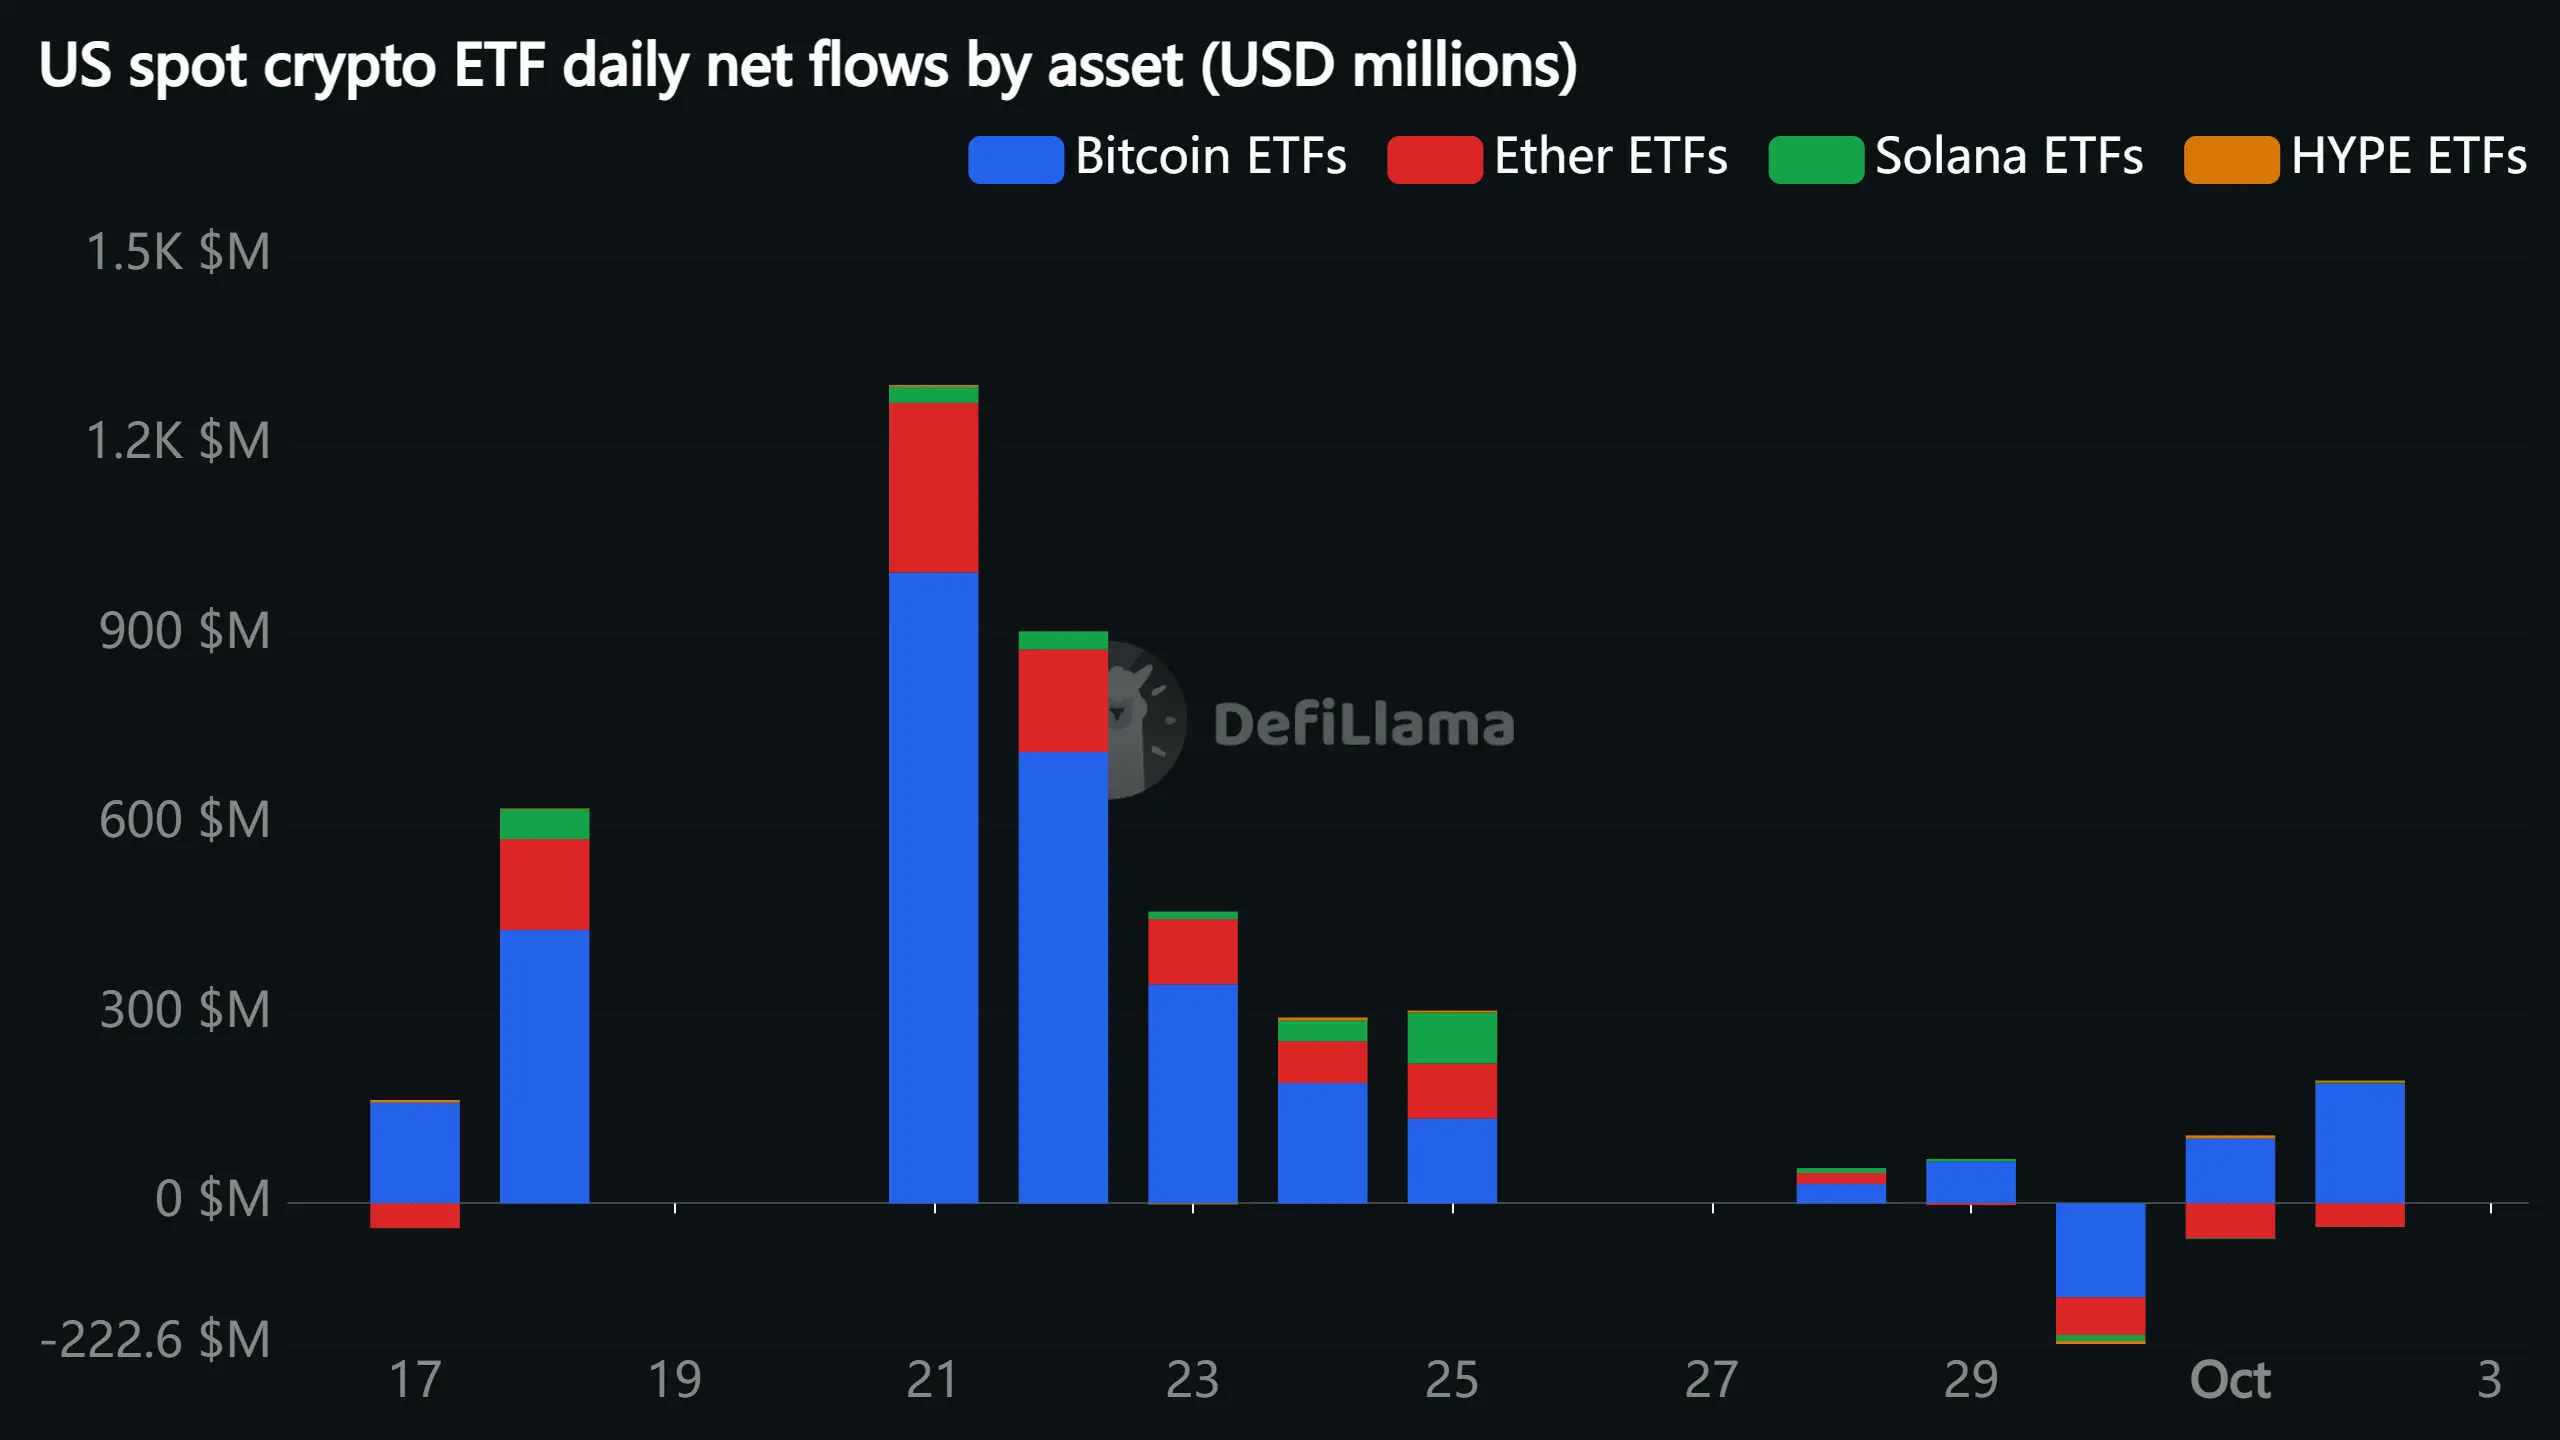
Bitcoin's outflow represented roughly 1,047 BTC at the day's price, which seems like a lot,
but only represented roughly 0.52% of the $17.2B daily spot volume.
Even more importantly, Bitcoin ETFs have been net positive over the last five sessions, roughly +$120M.
While this isn't a large amount of money, it is enough to be concerning if the selling continues.
## Bitcoin Is Holding Because the Selling Isn't Overwhelming Demand
ETF outflows do not necessarily represent an equivalent amount of Bitcoin being dumped on the exchanges directly, as some of the inflows/outflows may be between authorized participants, inventories and OTC liquidity.
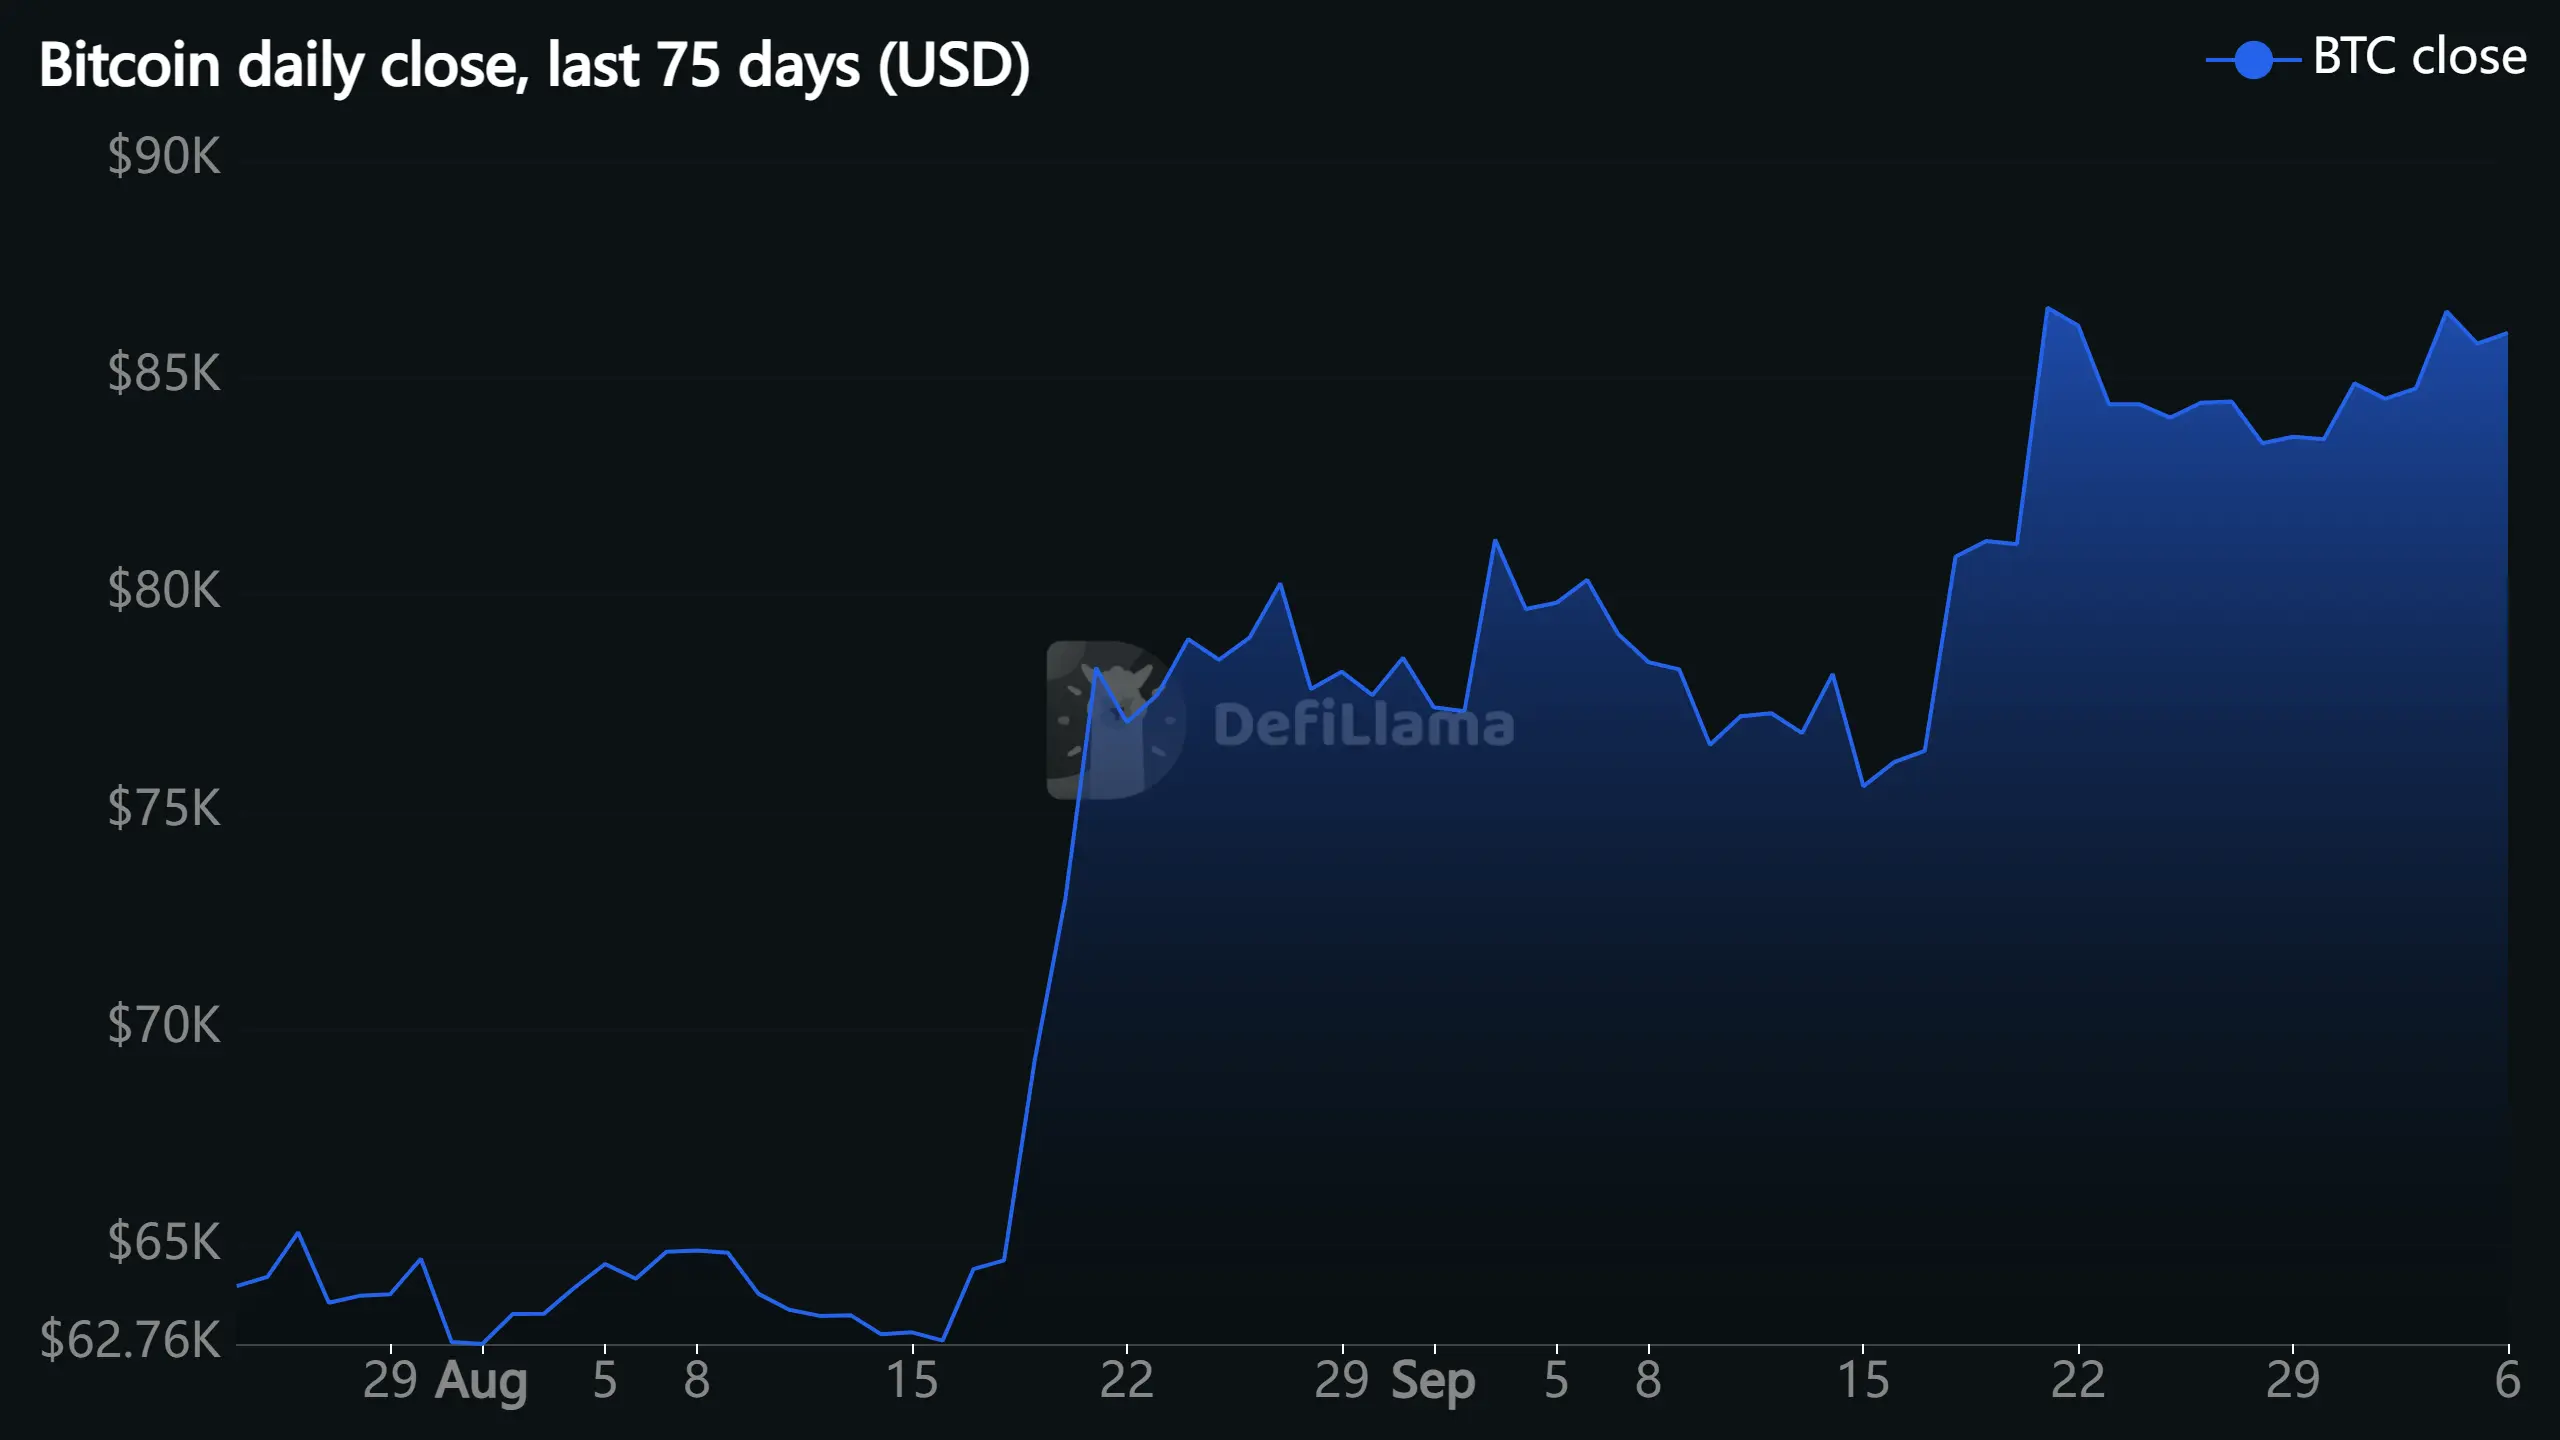
Meanwhile, Bitcoin's price-performance has been pretty decent recently:
7-day: +2.9%
30-day: +7.1%
60-day: +32.6%
90-day: +38.2%
This means that Bitcoin's supply absorption has been sufficient enough to prevent any large-scale correction.
Derivatives are also not extremely bullish, with Bitcoin futures open interest down, funding relatively modest and Binance positioning nearly balanced.
This suggests that the move is unlikely to be a leveraged blow-off.
## Stablecoins Are Growing — But Slowly
DeFiLlama data suggests total stablecoin supply around $306.8B.
The increase has been relatively steady, if not explosive:
7-day: +0.42%
30-day: +0.62%
60-day: +2.08%
USDT supply has increased, while USDC has contracted, with newer stablecoins such as USDe, USDS and USD1 gaining supply.
This suggests that liquidity is growing, but there isn't a massive wall of new cash rushing into crypto.
The implication is that this supports consolidation rather than a risk-on mania.
## DeFi Activity Is Improving — But Momentum Has Cooled
Global DeFi TVL currently sits around $96.2B, up roughly 1.5% over seven days and 9.1% over 30.
Some of the largest ecosystems have seen strong monthly performance:
Ethereum: +8.7%
Solana: +15.2%
Base: +13.4%
Bitcoin: +5.3%
That said, weekly DEX and perpetual volumes have cooled, suggesting that capital is staying in the ecosystem, but speculation has decreased.
This is another indication that Bitcoin's recent price-performance is more about consolidation than a leveraged blow-off.
## The Important Chart Level: Bitcoin Has a Ceiling
The most important level in Bitcoin right now is roughly $87,000-$87,400, as the crypto has repeatedly struggled at this price-range.
Price below that suggests support around $83,400-$84,000, with a September 28 swing low around $82,588.
This creates a relatively clear range-bound structure:
Resistance: $87,000-$87,400
Support: $83,400-$84,000
Major invalidation: ~$82,588
A strong close above $87,400, preferably with increasing volume and renewed ETF inflows, could open the door toward $90,000 would be a major confirmation of upward momentum.
A close below $82,588 would significantly weaken this range.
Macro Is Still the Biggest Risk
Bitcoin's performance cannot be considered in isolation, as the dollar remains strong, treasury yields are high and real yields are becoming uncomfortable for risk assets.
The 10-year yield is around 5.33% and the dollar index is near 102, at the same time that September payroll growth was considerably weaker than expected.
This is a strange combination of hawkish financial conditions, weaker economic data, resilient equities and Bitcoin.
While this environment is tolerable for crypto right now, it could change rapidly if real yields push above 3% and ETF outflows accelerate.
So Who Is Absorbing the Selling?
There isn't enough evidence to suggest a single buyer, but the most likely explanation is a combination of the outflow being relatively small compared to market liquidity, spot buyers absorbing supply, ETF flows being positive over the recent five-session, short covering contributing to demand, treasury companies continuing to add Bitcoin and stablecoin liquidity expanding.
The most important point is that this should not be considered aggressive accumulation.
Long-term holders are also taking profits into strength, and the market is simply absorbing the selling.
That said, the absorption does not confirm accumulation.
Three Scenarios From Here
Bull Case
Bitcoin breaks and holds above $87,400 with stronger volume and ETF inflows return.
In this scenario, $90,000 becomes the next major psychological and liquidity level.
Neutral Case
BTC remains trapped between roughly $83,400 and $87,400.
ETF flows alternate between inflows and outflows, open interest remains controlled and funding remains relatively low.
This suggests that consolidation will continue.
Bear Case
The warning signs would include:
BTC closes below $82,588
Bitcoin ETF outflows accelerate for several sessions
Open interest rises while price falls
Funding turns negative during weakness
Real yields remain above 3%
Spot buying weakens while long-term-holder selling increases
This would be the point at which ETF outflows become a larger problem.
What I'm Watching Next
The next few days are more important than Monday's $118M number.
Look out for:
1. ETF flows - Are Bitcoin funds returning to inflows?
2. $87,400 - Can BTC break the ceiling?
3. $82,588 - Does the larger recovery structure hold?
4. Open interest + funding - Is leverage building?
5. Stablecoin supply - Does liquidity continue to expand?
6. Real yields - Does the 10-year real yield move sustainably above 3%?
7. Spot CVD - Are actual spot buyers absorbing supply?
The Bottom Line
The headline reads "$118M Just Left Crypto ETFs. So Why Isn't Bitcoin Crashing?"
The data suggests that Bitcoin is still holding around $86K because the outflow represented a relatively small amount of broader liquidity, derivatives were reasonably controlled and stablecoin supply continued to increase.
This means that for now, this looks like a case of supply absorption, rather than a major institutional selling-off.
That said, the real test has not occurred yet and if ETF outflows accelerate while BTC breaks below $82,588, the situation changes considerably.
Until then, $87,400 is the level that Bitcoin needs to conquer.
This is market analysis, not financial advice.






