
⚡ Quick Takeaways:
Institutional Shift: After an 8-week drought of heavy outflows, US Spot Bitcoin ETFs recorded nearly $1 Billion (~$930M+) in positive net inflows over a 7-day winning streak.
Price Action: Bitcoin rebounded sharply from its local bottom near $63,000, testing resistance near $66,000–$66,700.
The Core Question: Is this the start of a massive macro rally toward $70K, or a clever "bull trap" engineered by institutional liquidity providers before the next FOMC decision?
When Bitcoin dipped below the $63,000 level earlier this month, retail market sentiment hit a wall of fear. Headlines warned of macroeconomic drag, rising crude oil prices, and geopolitical tensions.
Yet, while retail traders were frantically panic-selling or waiting for $55,000, institutional whales were quietly pulling off a massive accumulation maneuver.
According to recent institutional tracking data, Spot Bitcoin ETFs reversed an eight-week outflow trend by pouring nearly $1 Billion into BTC in just seven consecutive sessions.
Let’s break down what’s happening behind closed doors on Wall Street, what the key price levels mean, and how you can position your portfolio without falling into a trap.
The $1 Billion Reversal: Who Is Actually Buying?
For nearly two months, the dominant narrative surrounding Spot Bitcoin ETFs was one of stagnation. Redemptions had mounted as macro uncertainty forced funds to liquidate underlying assets to satisfy redemptions.
However, the tide flipped fast.
Spot Bitcoin ETF Trend Shift
-
The Turnaround: Rebounded sharply from -$8.0B in heavy outflows to over +$930M–$1.0B in fresh net inflows.
-
7-Day Streak: Recorded 7 consecutive sessions of aggressive institutional buying.
-
Total AUM: Global Spot Bitcoin ETF holdings stand strong at $80.9 Billion+.
(Sources: SoSoValue, Cryptonomist, Nasdaq Data)
Heavyweights like BlackRock (IBIT) and Fidelity (FBTC) led the buying spree. Rather than chasing euphoric breakouts, these institutional vehicles systematically absorbed retail sell orders at key discount zones between $62,500 and $64,000.
This isn't retail FOMO; this is dollar-cost averaging (DCA) executed at an institutional scale.
Technical Outlook: The Wall at $66,000-$67,500
Despite the surge in institutional spot demand, Bitcoin isn't in the clear just yet. It is currently locked in a tug-of-war against crucial technical levels:
[ $70,000 - Major Macro Target ]
^
|
[ $66,700 - Immediate Resistance ] 🔴 (Rejection Zone)
^
=== $65,000 - Current Consolidation Range === [BTC Trading Here] 🟡
|
[ $64,000 - Primary Support Zone ] 🟢 (Whale Buying Zone)
|
[ $58,000 - 2026 Local Low ]
-
Immediate Resistance ($66,000 - $66,700): Bitcoin briefly touched $66,700 during its rebound before pulling back toward $65,000. A daily candle close above $66,700 is required to trigger momentum trading toward $70,000.
-
Key Demand Zone ($64,000 - $64,350): Order book depth reveals dense buy walls near $64,000. As long as BTC holds above this support level on retests, the broader bullish structure remains intact.
-
Derivatives & Prediction Markets: Sentiment on prediction platforms like Polymarket shows over 60% of volume leaning toward a $67,500 target before the end of the month.
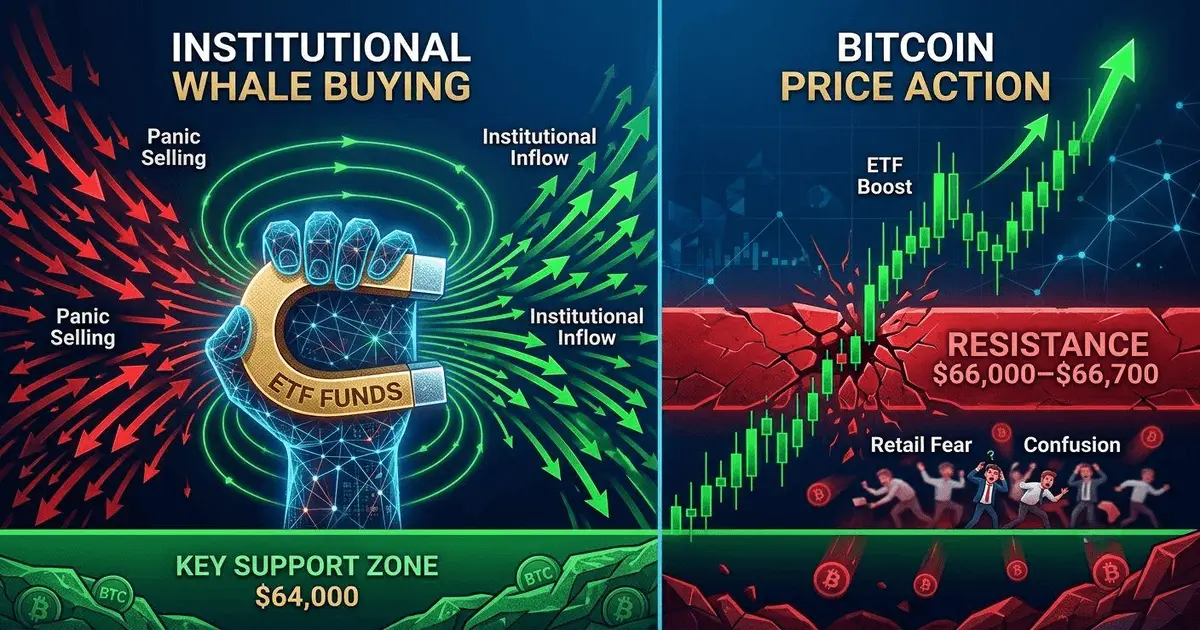
BTC tests crucial $66,700 resistance as spot institutional buying surges.
Bull Trap or Real Breakout? What to Watch Next
While a $1 Billion inflow streak is a strong bullish catalyst, smart investors shouldn't turn blind to macro risks:
-
Macro Uncertainty (FOMC Decision): The upcoming Federal Reserve interest rate decision remains a key driver for global liquidity. High interest rates keep cash yield high, occasionally constraining risk assets.
-
Lag in Exchange Liquidity: ETF flows reflect fund-level acquisitions, which don't always translate immediately to instant spot exchange volume. Always cross-reference ETF data with Exchange Net Inflows/Outflows.
Practical Action Plan for Crypto Investors
If you are navigating this market, here is a risk-managed framework:
-
Avoid Buying Impulse Breakouts: Don't market-buy blindly when price spikes into major resistance ($66,000+). Wait for a confirmed breakout or a healthy pull-back to support.
-
Track Real Inflow Data: Follow daily institutional flow summaries from verified trackers like SoSoValue or CoinGlass rather than relying on social media hype.
-
Protect Capital: Use tight stop-losses if you are trading leverage. A slip below $64,000 could target liquidity pools lower down.
Research Sources & Data References
To maintain transparency and research integrity, the data points in this report are backed by the following market data providers and institutional tracking services:
-
Institutional ETF Flow Analytics: SoSoValue ETF Tracker & Cryptonomist Flow Data (July 2026).
-
Market Price & Order Book Metrics: CoinGecko, Nasdaq Data via The Motley Fool, & Bloomberg Terminal.
-
Derivatives & Prediction Sentiment: Polymarket BTC Target Markets (July 2026 Data).
💬 Over to You!
Do you think this $1 Billion ETF streak will launch Bitcoin past $70,000, or are we going to sweep lower liquidity first? Drop your thoughts and price predictions in the comments below! If you found this analytical article helpful, don't forget to leave a tip!
Disclaimer: This post is for educational and research purposes only and does not constitute financial advice. Always do your own research (DYOR).
⚡ Never miss an urgent market shift: I post daily real-time crypto setups, micro-analyses, and exclusive charts. Follow My Daily Updates Here
🚀 Duplicate CryptoVault Now: Grab your automated Notion Trading Journal here for 50% OFF with code LAUNCH26
👉 Stop trading blindly: Secure your CryptoVault on Gumroad now to master your risk analytics and protect your capital.
🎥 Bonus Creator Tools: Free Crypto Editing Assets
If you create crypto updates, TikTok reels, or YouTube Shorts based on today’s market analysis, use these editing templates:
-
Free CapCut Crypto Presets (Notion Library) – Download customized editing presets on Notion to style your charts & market reels.





